
$5,557 Was Reached, Key Elements to Watch
SPX soared despite its bearish weekly setup, is it too soon to celebrate?

What a day, it looks like SPX bounced as the less probable scenario presented on Saturday suggested. Below you will read a complete analysis to balance different contextual factors including VIX, S/R Levels, and what technicals are saying.
Before that, let me provide some contextual charts about Small Caps, since it continues being a hot topic:
IWM
The technical chart shows a bounce from the 10DMA, which is a common pattern in bullish trends when price retraces to that moving average from a jump above the Bollinger Band.
$219, the central S/R level was recovered, that is a positive reference and it suggests that Small Caps will start building a new volume base between the current level and $226.
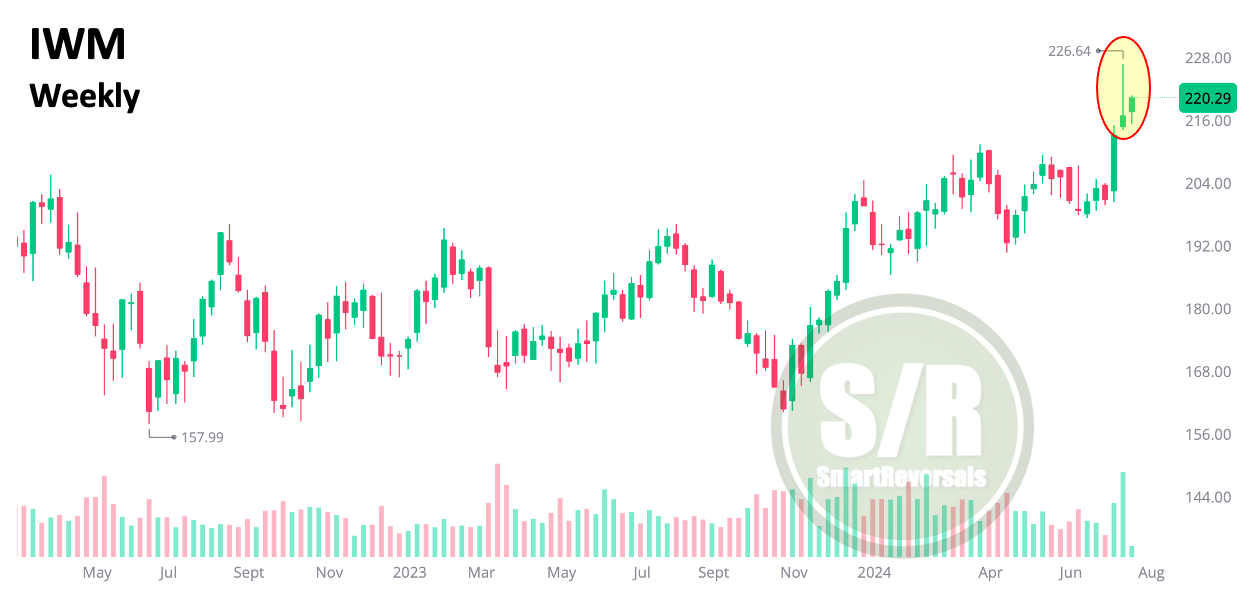
Last week, the RSI reached 81, a level not seen in many years. The last time it was this high was on October 3rd, 2017, when a pullback to the lower Bollinger Band occurred, followed by a price increase of 7% above the overbought RSI level three months later.
As mentioned in the Weekly Compass, the weekly chart doesn't look ideal with such a high wick on the candle, but IWM has historically proven to be a strong performer after a breakout.
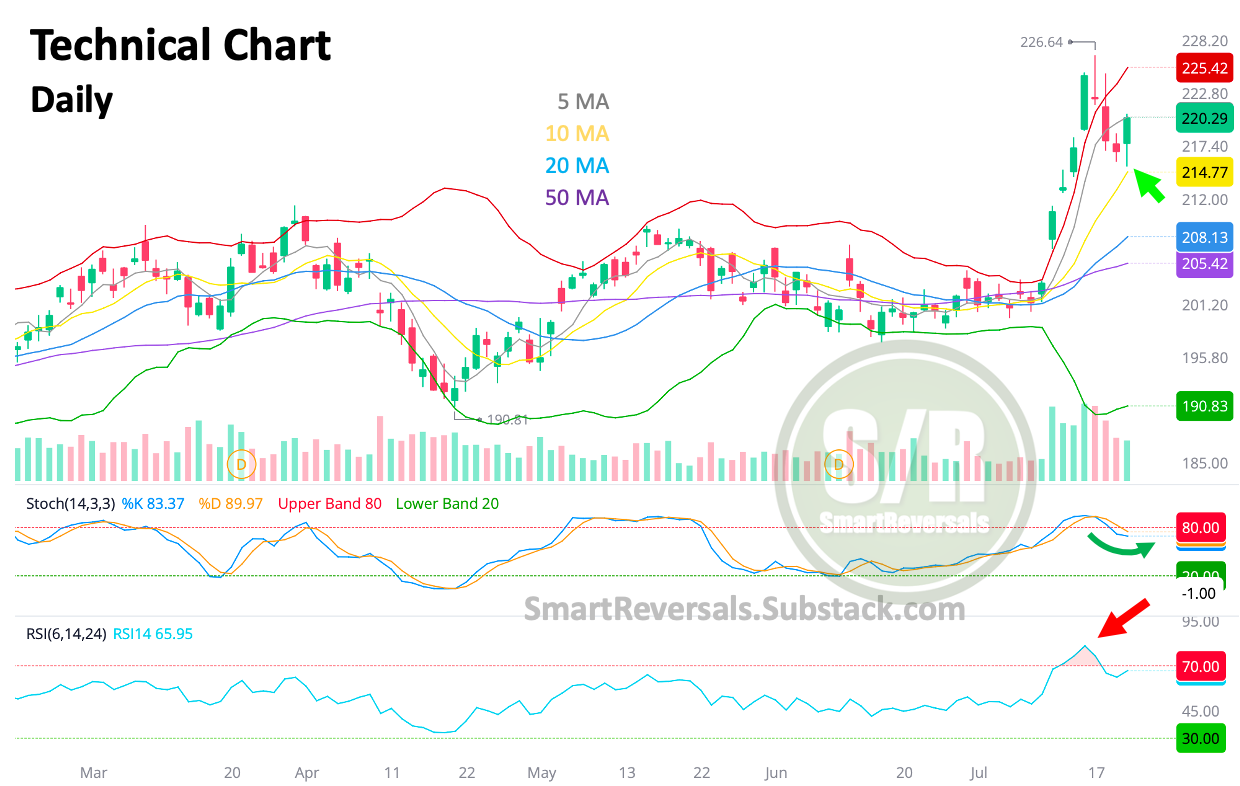
The invalidation case for the bounce is:
Rejection at the 5DMA (grey line)
Losing $219
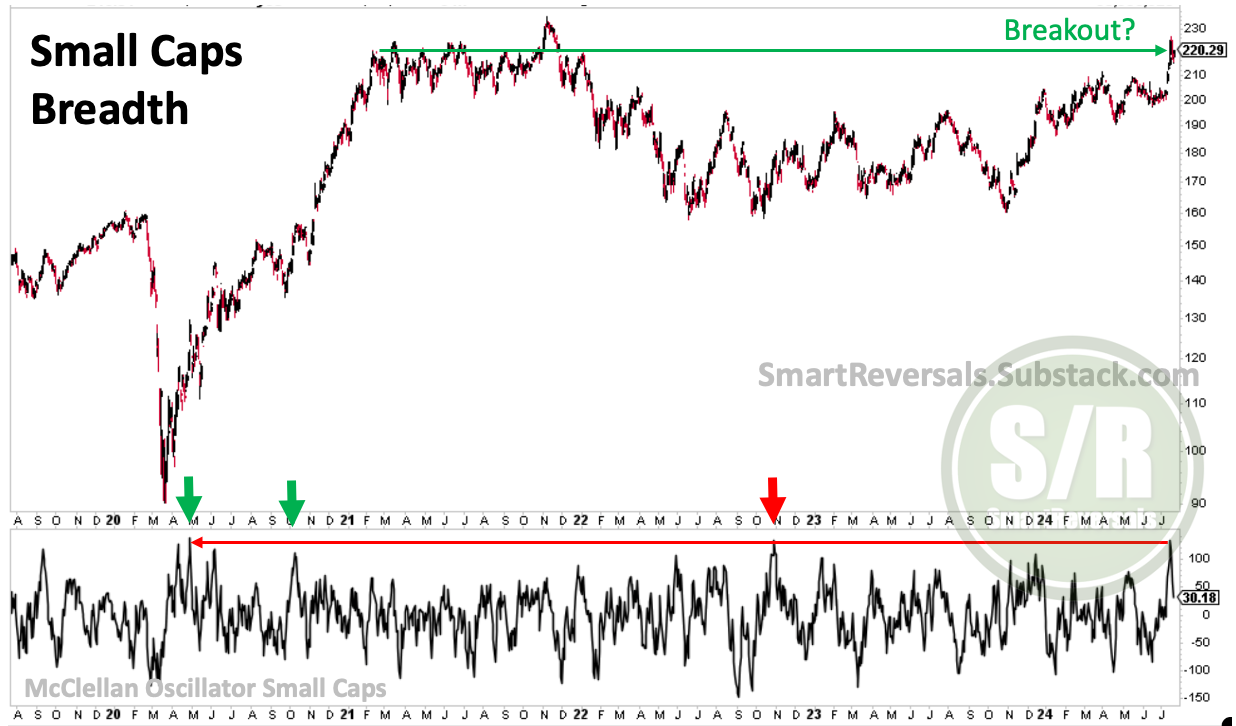
Breadth was very high last week for Small Caps:
The McClellan Oscillator has reached levels not seen since the 2020 bounce from the COVID crash, suggesting a potentially positive market context. However, as the red arrow highlights, there was a similar instance where prices did not continue to soar but instead declined.
If this is indeed a breakout, as the green horizontal arrow suggests, this breakaway signal would be bullish. Short-term technical factors were addressed in the previous chart.
Three Contextual Charts for Small Caps:
Small-cap companies are projected to experience a significant boost in earnings, with a year-over-year increase of approximately 20% anticipated from the fourth quarter of 2024 and continuing throughout 2025:

However, expectations for small-cap earnings per share (EPS) in the first three quarters of this year have been significantly reduced compared to initial projections:

Anyway, Small Cap funds in U.S. recently saw the second largest weekly inflow ever, the first one was in 2007.

Conclusion for Small Caps:
Technically speaking, the references for a continuous bounce were provided, it is possible considering the liquidity recently injected; but be mindful about the weekly chart and that long wick.
Giving more oxygen to price action, $216 is a more relevant level that cannot be breached in the short term if this is a breakout.
More technicals were included for the weekly chart in the latest Weekly Compass, access here:
https://smartreversals.substack.com/p/the-vix-awakens-and-the-bearish-warnings
SPX
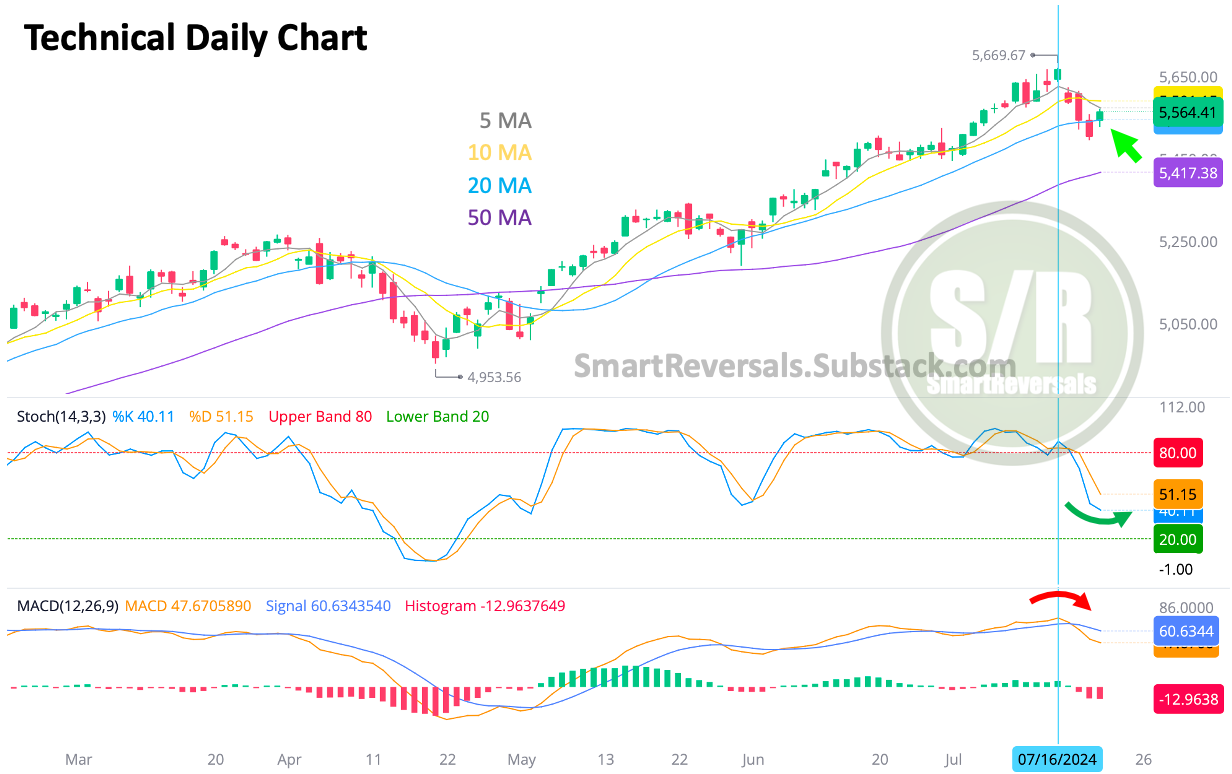
The blue vertical line indicates the date the breadth thrust was triggered. In the previous edition of Level Up Your Trading (link below), eleven cases (including the one with the deepest pullback) signaled a coming bull leg.
https://smartreversals.substack.com/p/breadth-thrust-signals-short-and
However, timing a bottom after a signal that has been seen less than 30 times in the last 70 years is challenging. That's why I included a scenario with an immediate bounce in the latest edition of the Trading Compass.
Regarding this chart, the 5DMA must be recovered to see more confirmation of a bottom.
Another level that can put some pressure on SP500 is $5,578. A level to surpass to have more references of a sustainable bounce.
Some charts are worth watching. To balance risk tolerance and expectations, this section of the edition is available to paid subscribers as a follow-up to the weekend edition and a good example of what needs to be measured: