
A Study of Bounces Across Six Major Market Corrections
Is this a Potential Bear Market Bottom


The SPX reached $4835, very close to the $4800 target highlighted in previous analyses that raised warnings based on Elliott Wave and Fibonacci projections. For access, click here. This target was anticipated since December, in the middle of the euphoria, aligning with typical patterns observed during past bear markets, including those of 2022, 2000, and even 1987. Today’s analysis focuses on navigating bear markets and anticipating their rallies, emphasizing that profit opportunities exist even within downtrends with the appropriate mindset and technical strategy.
The question remains: is the bottom in? Is today’s rally the validation of a major bottom? The current market exhibits unique characteristics compared to others. It's self-inflicted, yet it has unfolded with remarkable speed, breaking numerous technical levels and consequently inflicting significant damage on the price action structure. The bounce today was constructive, it came from below the Bollinger band and oscillators are extremely oversold, suggesting a bottom is in.
Last Saturday, using the weekly Support and Resistance levels, this diagram outlining the expected price action was shared with premium subscribers LAST SATURDAY, presenting three distinct scenarios, all pointing towards a lower low. Once again, the price action unfolded with exceptional speed reaching the bearish target, completing the down move by Tuesday, and including the bullish move today.
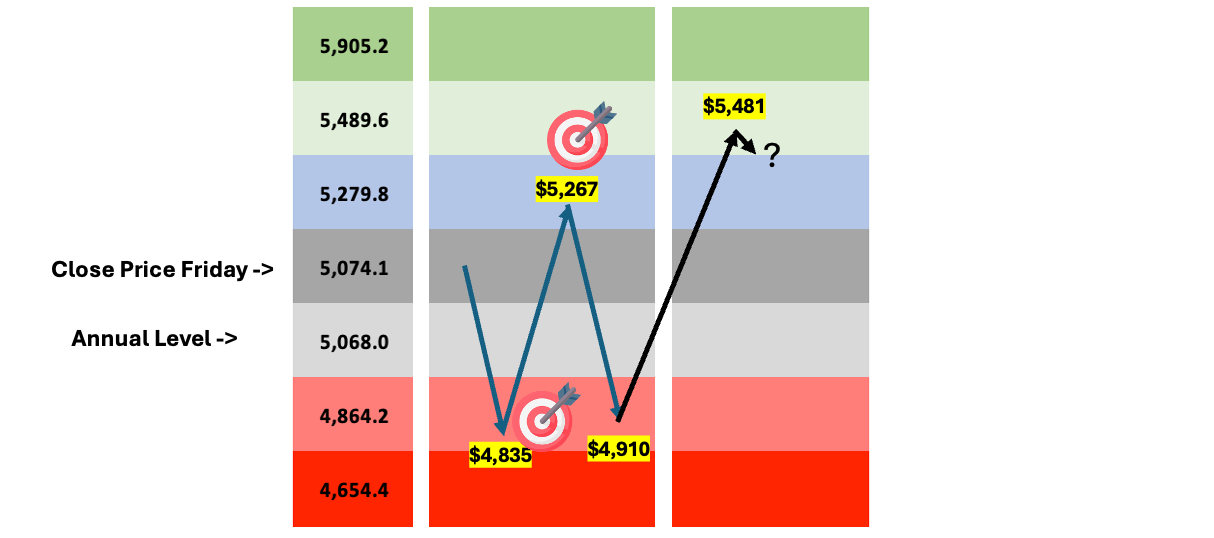
The thesis for a 8% bounce was temporarily invalidated, however, today the SPX low held at the $4,864 support level, and the subsequent rally precisely reached $5,481 before a minor pullback. What's next? This is part of the updated analysis following our study of bear market bounces. In the interim, it's crucial to remember that a bearish crossover of the 50-day and 200-day moving averages is imminent for the SPX, a signal whose significance over the past decade we analyzed just two weeks ago, for access, click here.