
Back to Turbulent Waters - Defense Levels Breached
After two 20%+ gain years for the SPX, expect more reversals than a straight uptrend in 2025. This volatility can mean greater profit potential for skillful investors.


In the previous Weekly Compass, several key price targets were identified. For the SPX, the bearish target was $5,776, and the week's low was $5,807, a 31 point difference in the middle of optimism for a bounce that this publication also anticipated was going to vanish.
GLD's bullish target of $246 was precisely reached by Thursday. On Friday, the price advanced to the next resistance level shared in the S/R levels. SLV's target was $27.4, which the price accurately reached, subsequently flipping it to support. By Friday, the next resistance level of $27 rejected a further advance.
The NDX setup was analyzed as a short-term bullish bounce within a medium-term bearish trend, with a bearish target of $20,964.6. The price did bounce on Monday, but this move quickly faded. By 1 PM on Friday, the price was precisely at $20,964, before declining further in the afternoon.
AAPL was analyzed as bearish with a target of $239. The price attempted to hold this level until Friday morning, but the sell-off intensified, reaching the next support level of $234, generating a temporary bounce.
NVDA's bearish target was $137.5; the stock closed the week at $135.9. META continued to move as the consolidation thesis suggested. GOOG has not yet negated its bearish setup. AMZN's bearish target was $219.8, and the stock closed the week at $218.9.
PLTR presented a compelling example of the effectiveness of S/R levels. The sell-off was not unexpected, given the bearish setup with an extremely overbought RSI and a shooting star two weeks prior. The week's closing price was $67.26, nearly identical to the third support level for the week at $67.34. This demonstrates how S/R levels act for price action much like the staff acts for musical pitches, providing clear reference points.
Bitcoin's low for the week so far is $91.4K, compared to a target of $93K in the latest Weekly Compass. While most stocks exceeded their bearish targets, TSLA continues to show demand before reaching its own. Is this a false consolidation signal, similar to what PLTR exhibited last week before its sharp sell-off? The analysis is available here.
As you can see, the directional analysis has been accurate, with several targets being hit with precision and others coming incredibly close. This level of precision, combined with the comprehensive market overview provided by this publication, is valuable for investors seeking to navigate the complexities of the market. By subscribing, you gain access to this detailed analysis, empowering you to make more informed investment decisions and potentially enhance your portfolio performance.
Before continuing, two recent publications are essential context: the latest sector analysis and the most recent analysis of macro indicators, they provide updated charts and the fundamental criteria that has to be considered. Yesterday's jobs report, while positive for the overall economy, was not well-received by the market, as it reinforces the thesis of fewer rate cuts given the Federal Reserve's potential need to further cool the economy.


This edition presents three charts open for everyone (DJI, IWM, and SMH). Those three securities and the following ones are permanently included in this publication every week: SPX, NDX, TSLA, Bitcoin, NVDA, AAPL, GOOG, MSFT, META, PLTR, AMZN, TLT, GLD, NAT GAS, DXY, and SLV. Other charts are also part of this analysis, helping to analyze volatility (VIX), and stock participation (Breadth charts).
Let’s begin.
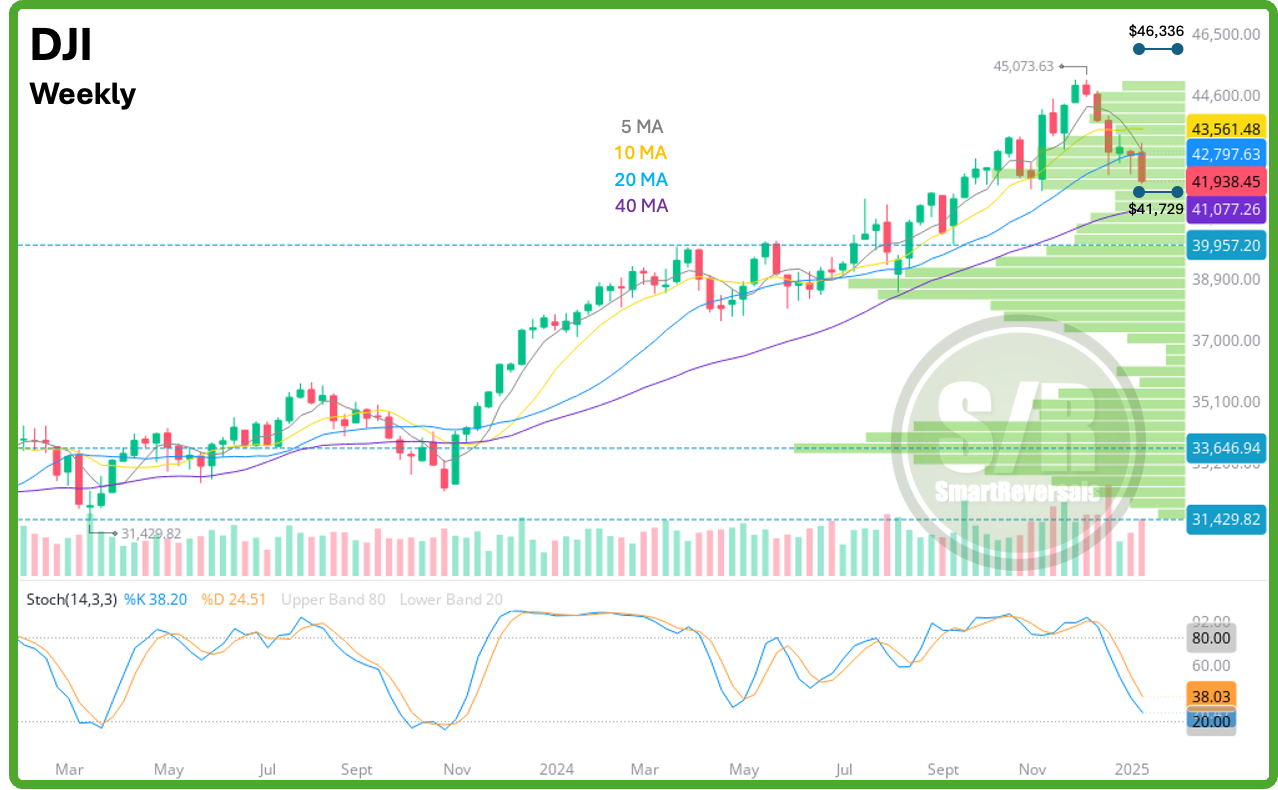
DJI
Setup: Bearish, getting close to oversold levels
Considering: Bearish weekly and daily candles, oscillators are not oversold but bullish divergences are appearing in the daily chart, setting higher lows in oscillators and lower highs in price.
The current target zone for bearish continuation is $41,505 - $ 41,435.
Price has to recover this key level next week to consider a valid any intra-week bullish reversal: $42,310
Target for a bullish reversal if the key weekly level is recovered: $42,743.4
Last week, this analysis set $42,548 as the immediate bearish target, price action crossed that level with conviction reaching the annual S/R level at $41.7K, next week that level will be matched by the 40MA, adding strength to that zone for a potential bounce. The mid $41K level presents a lot of support levels.
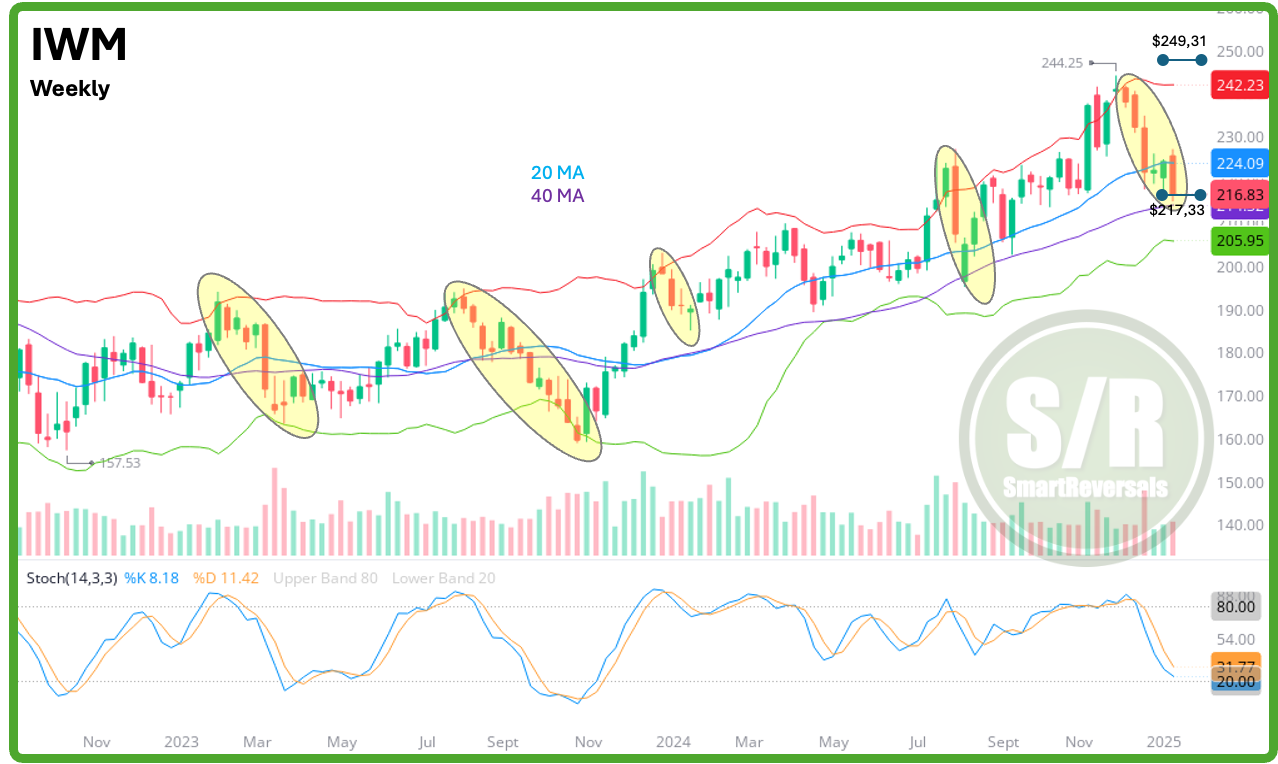
IWM
This publication correctly anticipated a technical bounce last week, identifying $226.9 as a key upside target within an overall bearish outlook. The downside target was $216. The week's high reached $227.1, and the price closed Friday at $216.8; a remarkably accurate forecast.
Setup: Bearish nearing oversold levels.
Considering: Weekly candle, the 20 weekly average has been breached so continuation to the 40MA is likely. The oscillator suggests there is room for further decline. There are good chances of a reversal candle incoming (including a lower low).
The current target for immediate bearish continuation: $212
Price has to recover this key level next week to consider any bounce valid for a bullish reversal: $219.8
Target if the key weekly level is recovered, which has a remote likelihood: $ 224.3
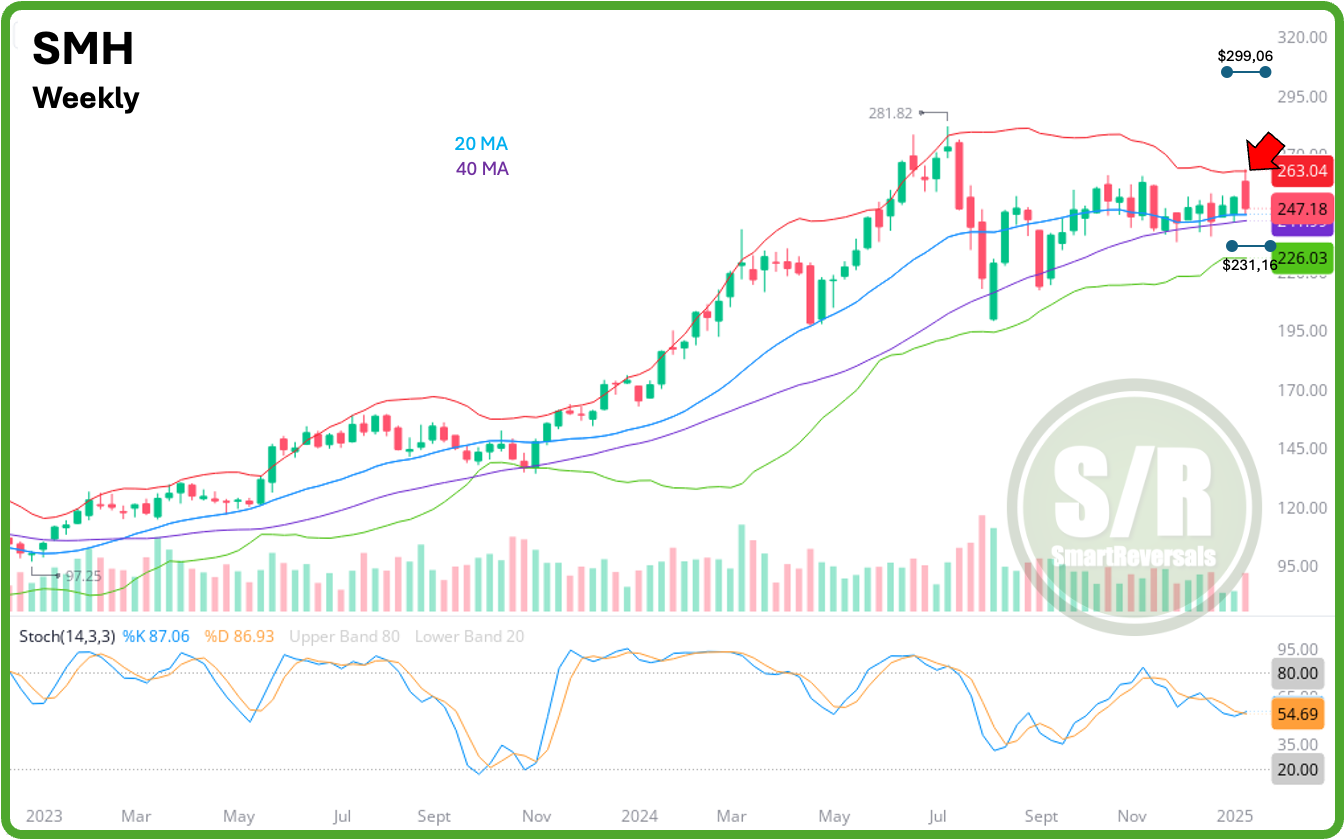
SMH
Setup: Consolidation continues
Considering: The bullish expectation happened on Monday, but price moved too far too fast reaching the higher weekly Bollinger band and soaring above the daily one, hence the pullback. Price closed the week right at the 20MA, once again providing support after many consecutive weeks.
Immediate target for bearish continuation: $ 240; with some chances of finding support at $243.
Price has to recover this key level next week to consider bullish resolution after months at the 20 weekly average: $251.9
Bullish target if the key weekly level is recovered by the close on the daily: $258.9
These three charts provide references of what is below the paywall for SPX, NDX, TSLA, Palantir, Bitcoin, NVDA and many more, you can do 2 things if interested: 1) Upgrade your subscription to continue reading, and/or 2) Go to the top of this email and like in the heart symbol, even from your email Substack captures your reaction. with a good number of likes I’ll keep these three charts open for the next publication.
Next week is critical for the market. We're at a potential turning point—either a reversal at key levels mentioned below, or an acceleration of the sell-off, building on my thesis of a significant correction when the SPX reached $6,109. The all time highs were at $6,099 so the target can be considered reached with precision, considering it was published since September 2024 for premium subscribers.
SPX