

The Support and Resistance Levels, published every Friday, include more than 40 securities and combine weekly with monthly levels. The significant attention from premium subscribers to these levels have motivated me to model more stocks and ETFs, and since few weeks ago to combine them. This is a guide to use them in an optimal way.
Weekly Levels: The Swing and Day Trader's Guide
When analyzing price action relative to the weekly central level, you're essentially looking for a medium-term directional bias and key weekly support/resistance levels.
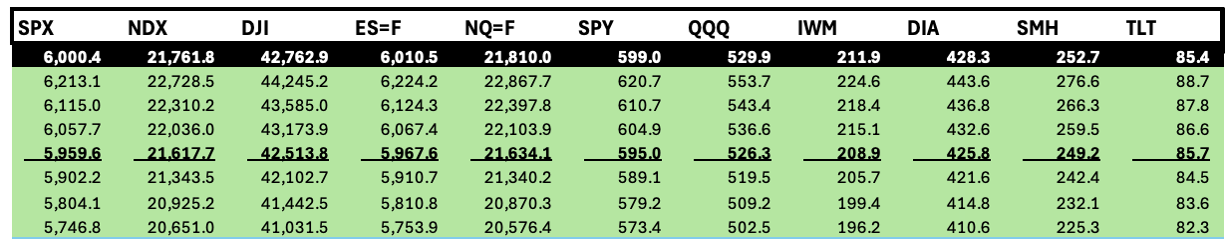
The weekly levels for the week that just ended are below, $5,959 was the central level for SPX that maintained bullish momentum. The top of the week was $6059, exactly at the first resistance level ($6,057), and on Friday the price bottomed right at that $5,959. Both levels mentioned were posted in the paid Subscribers section last week.
This publication has the updated levels for next week, but let’s study the educational content first.
What it Means to be Above/Below the Weekly Central Level When Analyzing Price Action
Above the Weekly Central Level (Bullish Bias):
Short-Term Strength: When price action consistently trades above this level, it suggests a dominant bullish sentiment for the current week. This indicates that buyers are generally in control on a week-to-week basis.
Weekly Support: The weekly central level acts as a key support level. If price pulls back on a daily or intraday chart and finds support at the weekly central level, it's often seen as a good opportunity for bulls to re-enter or add to positions, expecting the uptrend to continue for the rest of the week. However, if the level is breached, there would be bearish confirmation and vice versa. I always check candlesticks and oscillators to improve probabilities of success when using the levels. When a level is crossed by a long green or red candle, conviction can be considered, but when price action prints a doji, hammer (for supports) or a shooting star (for resistances), a reversal is likely. I use 2Hour and 4Hour candles, but you can use 30 Minutes or 1H timeframes.
Targets Higher Resistance: Traders will often look for price to advance towards the weekly resistance levels (as mentioned in the weekly compass every Saturday, as the immediate bullish target if the price remains above the central level).
Confirmation of Uptrend: If you're seeing a daily uptrend, price staying above the weekly central level provides a strong confirmation that this uptrend has momentum on a larger, weekly scale.
Below the Weekly Central Level (Bearish Bias):
Medium-Term Weakness: Conversely, if price action consistently trades below the weekly level, it signals a prevailing bearish sentiment for the current week. This indicates that sellers are generally in control.
Weekly Resistance: The weekly central level, in this scenario, acts as a key resistance level. If price attempts to rally on a daily or intraday chart but is rejected at the central level, it often suggests the bearish trend will continue for the remainder of the week.
Targets Lower Support: Traders will anticipate price declines towards the weekly support levels, beginning at the first bearish target that could provide support, otherwise the bearish momentum would accelerate towards the supports below.
Confirmation of Downtrend: If you're observing a daily downtrend, price remaining below the weekly central level confirms that this downtrend has significant weekly momentum.
Setting Weekly Targets/Stops: Weekly levels can serve as targets or stop-loss references for swing and day trades. (The specific level can be reached, so the stops must have a prudent distance from it)
Identifying Weekly Breakouts/Breakdowns: A strong close above the first weekly resistance (or bullish immediate target in my publications) or below the first weekly support (or immediate bearish target) can signal a significant move for the rest of the week or even longer.
In essence, the weekly central level serves as a "line in the sand" for the current week's directional bias. Daily fluctuations around this level will be interpreted in the context of whether the price remains above or below it. For stop loss remember that specific levels can be tested, so setting some distance (stops for shorts above the level, below the level for longs)
Timeframe for Analyzing Price Action with Weekly Levels
They are most effectively used to analyze price action on shorter timeframes to provide context and define trade setups within the broader weekly outlook.
Daily Chart: This is an excellent timeframe to overlay weekly levels.
Trend Confirmation: You can easily see if the daily candles are opening and closing above or below the weekly central level, confirming the weekly bias for the day.
Pullbacks to Key Levels: Daily charts allow you to identify pullbacks to the weekly central level or its S/R levels, which can be optimal entry points for swing trades.
4-Hour, 2H, and 1-Hour Charts: These timeframes are also suitable for using weekly levels.
Intraday Context for Day Trades: They provide crucial context for intraday price action within the weekly framework.
Finer Entry/Exit: You can use these shorter timeframes to fine-tune your entry and exit points once you've identified a strong setup using the daily chart and weekly levels. For example, if the daily chart is bouncing off the weekly first support, you might drop to the 1 Hour chart to look for a specific bullish candle pattern to trigger a long entry.
Monthly Levels: A High Level Compass
The monthly central level provides a high-level "compass" for the overall security direction and sentiment throughout the entire month.
A daily chart might show intraday pullbacks, but if the price remains above the monthly central level, the broader bullish sentiment for the month would still be considered intact, and vice versa.
Mid-Term Bullish Bias: If the daily price action is consistently trading above the monthly central level, it generally indicates a strong underlying bullish sentiment for the entire month. This suggests that the bulls are in control on a larger scale.
Traders and investors will look for price to reach higher monthly resistance levels when the price is above the central level, and vice versa for support levels when the price is below the central level.
Trading below the monthly central level confirms the overall weakness of the asset or market for the current month.
This makes them ideal for position traders and those with a mid-term investment outlook. They provide a broad, overarching view of the market's sentiment for the entire current month. A strong move past a monthly resistance or support can signal a powerful trend continuation or reversal on a larger scale.
Strategic Planning: Use monthly levels to establish your monthly bias. If you're fundamentally bullish on a stock for the medium or long term, but it's trading below its monthly central level, you might wait for it to reclaim that level before increasing your position, or use the weekly levels to manage risk in the short term if the chart is showing signs of a bullish reversal conquering weekly resistances.
Setting Long-Term Targets/Stops: Monthly resistances or supports can be used as more aggressive long-term profit targets or wide stop-loss levels for position trades.
Be mindful about this: A level is not a reversal guarantee
Combining Monthly and Weekly Levels
This is where the real power comes in. Don't use them in isolation.
Start with the Big Picture (Monthly Levels): First, identify the monthly central level and its S/R levels. This sets your primary bias. If the price is above the monthly central level (bold and underlined number with blue background in the tables below), your default stance might be bullish and pullbacks would be confirmed as significant bearish reversals when the central monthly level is lost.
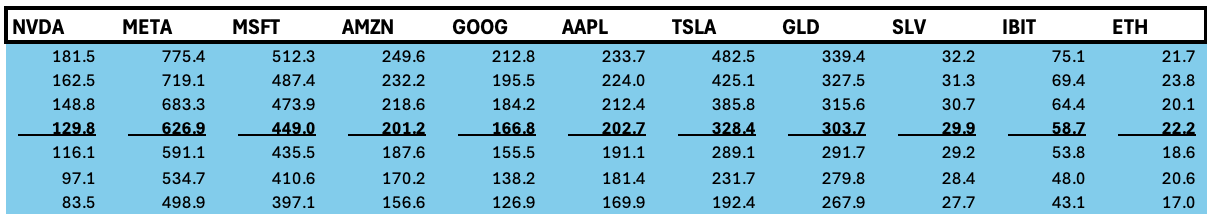
The weekly example provided the levels for the indices in the table above, the example for the monthly levels is for the Magnificent Seven stocks, metals, and crypto ETFs. The central level is highlighted in bold and underlined format.
Refine with the Medium Picture (Weekly): Then, overlay the weekly central level and its S/R levels. The ones for the week that just ended were:

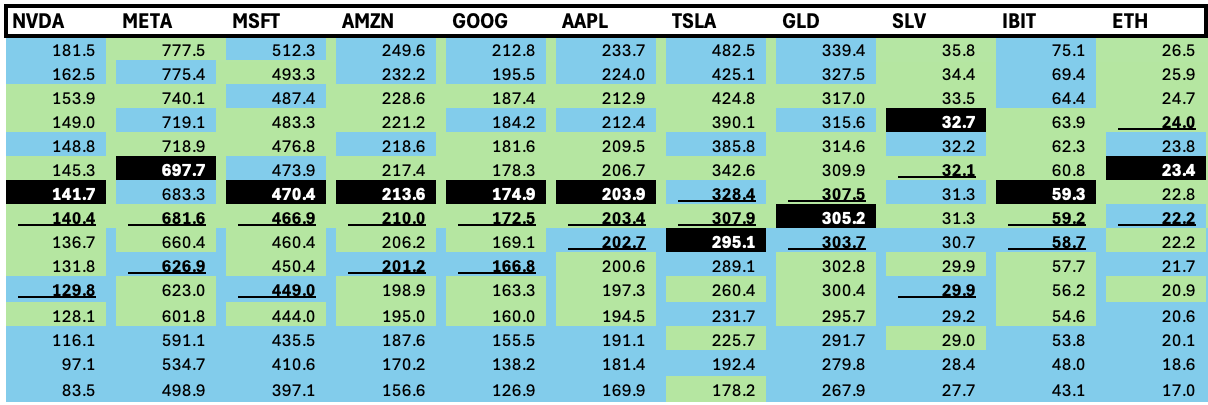
Confluence is Key: Look for instances where a weekly central level aligns closely with a monthly central level or a monthly S/R level (two lines combined are relevant even if it is a weekly central level and a monthly resistance level. These areas become stronger than when the lines are separated among each other.
In the actual case for the week that just ended, $203 was a strong level for AAPL, considering the alignment between the weekly and monthly levels. On Friday, that zone was breached. Similar case for IBIT, the biggest ETF for Bitcoin, $59 is a strong zone that as of Friday provided support.
Trend within a Trend: Staying above both weekly and monthly central levels indicates bullish momentum, there are usually pullbacks when this condition persists for several weeks, since the price becomes overheated relative to oscillators.
Warning Signals: If a weekly downtrend breaches monthly support, it's a stronger signal of a potential long-term reversal than just a daily breach.
Move down to your preferred trading timeframe (e.g., Daily or H4 for swing trading, H1, 30m or 15m for day trades and shorter swings) and overlay the monthly and weekly levels.
By doing this, you're ensuring that your trades are aligned with the prevailing sentiment on a more significant timeframe, reducing the noise of shorter-term movements and improving the probability of success for your swing trades.
Always Use with Technical Analysis
You can assess probabilities for a bounce or a pullback with price action, and being consistent with the educational content, starting from the weekly timeframe helps to assess probabilities for bullish continuation/reversals or bearish continuation/reversals.
The analysis for the chart and levels for next week are below, if you trade or invest in the SPY, or in any of the following securities, this publication is for you:
SPX, NDX, VIX, IWM, SMH, DJI, BRK.B, TLT, GLD, SLV, PLTR, NFLX, AAPL, GOOG, TSLA, NVDA, META, AMZN, MSFT, BITCOIN, QQQ, DIA, ES=F, NQ=F, AMD, AVGO, LLY, IBIT, ETH, UNH, MSTR, COST, PFE, TQQQ, SQQQ, UDOW, SDOW, UPRO, SPXS, URTY, and SRTY.
This publication analyzes consistently those securities, so you have a broad perspective of the market, and a set of options to make informed decisions.
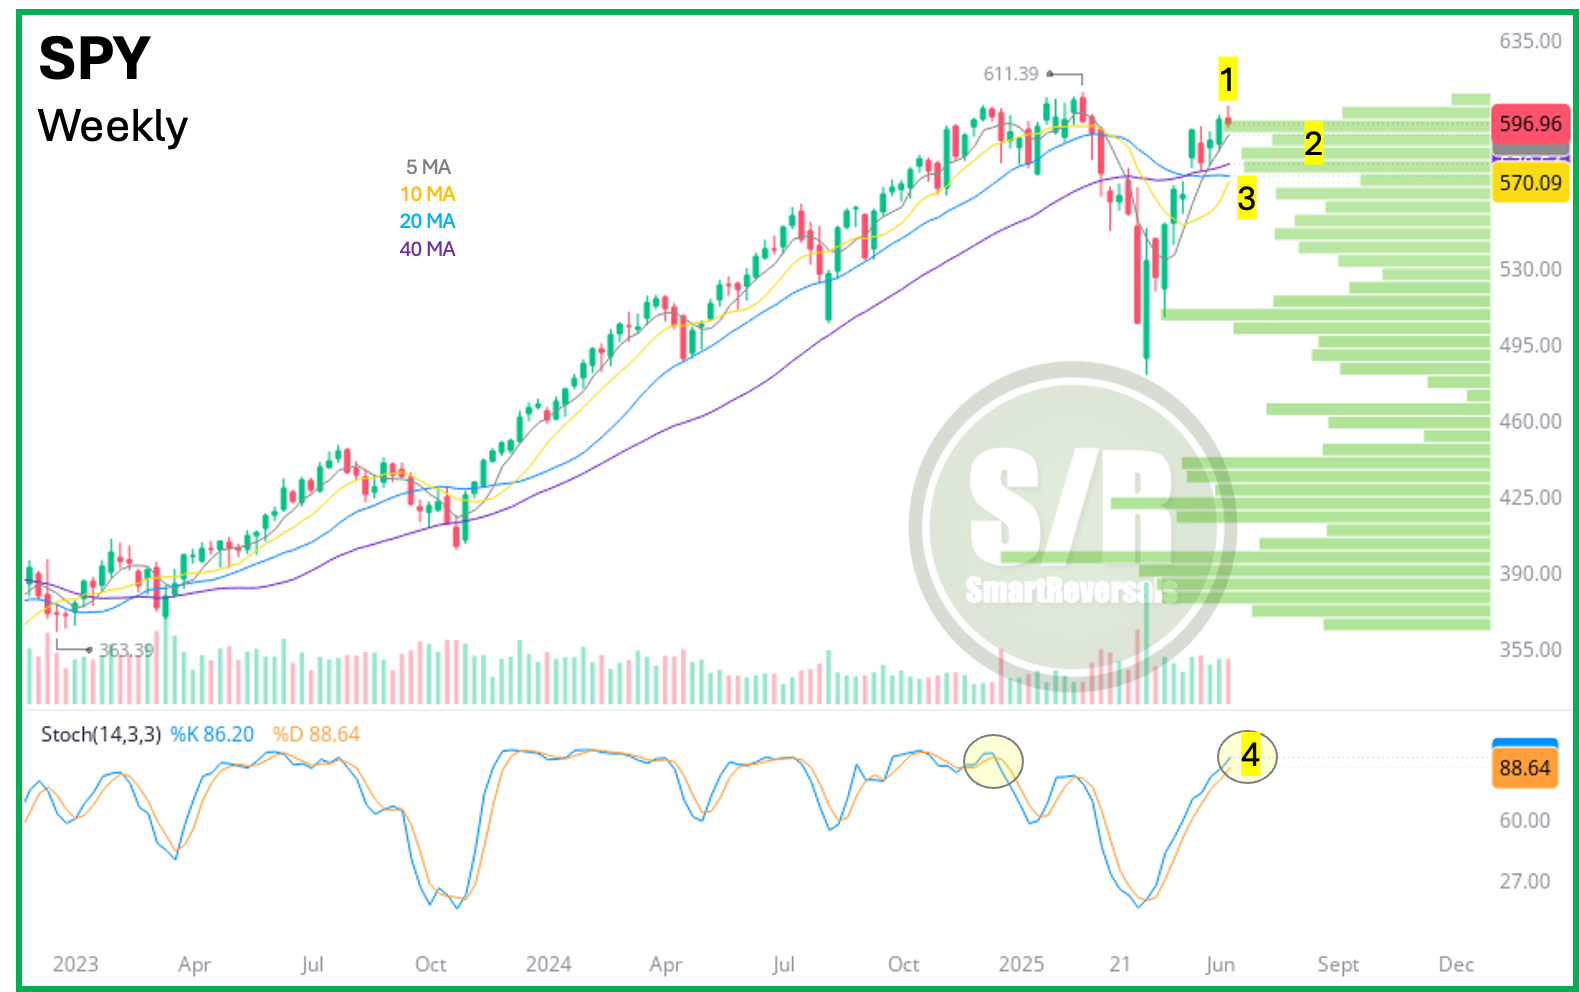
The market is suggesting a pullback is coming, and a lot of bearish sentiment will emerge, the publication from last Wednesday is a must-read, so you can see historical charts and objective analysis to help you make informed decisions, not driven by emotions.

Let’s continue with the analysis for SPY, and the levels.
WEEKLY SUPPORT AND RESISTANCE LEVELS AND SPY ANALYSIS: