
Buckle Up for the Fed
Prepare for next week’s volatility with precise indicators to watch and high probability setups


This Weekly Compass correctly anticipated bullish moves in individual securities last week based on the high probability setups listed, the bullish moved were significant: META jumped +3.9%, TSLA surged +5.8%, SMH rallied +3.5%, SLV gained +3.4%, COST reached its bullish target of $924 and retraced, same case for AMZN that touched the bullish target $236 and reversed; in the case of IWM $253 the price also neared the bullish target for a decent +1.0% move (following a 6% rally the previous week, a bullish move anticipated in this publication two weeks ago).
The purpose of working with a permanent watchlist like the one I have is to find the best individual setups when the major indices are in consolidation as it happened this week, something that was also considered a week ago in the previous Weekly Compass for the SPX and NDX.
We will study today the high probability setups for the week ahead using the momentum map and the individual technical analysis for each security, so you see the list of my top picks, and then you can read the individual analyses.
The Momentum Map helps analyze the stage each security is currently in, as the moves are generally circular, which the securities zoomed in today demonstrate.
LLY and ETHEREUM are clear examples of how a security moves among the quadrants. Just three months ago, the crypto market was in euphoria, and today the price action is struggling to find a bottom. In the same vein, the mega cap pharma company LLY was trying to find support three months ago, and the rally recently observed has been stronger than that of many popular tech companies.
My bullish view on AAPL months ago was initially related to the Momentum Map and then the technical setup, as was the case with WMT. Upgrade your subscription to see the full picture. Always remember that a leading stock (green quadrant) or a lagging one (red quadrant) can be in extreme conditions brewing a reversal; for that reason, individual analysis is essential. For example, LLY has already retraced -6% in December because the prior +40% rally was overextended. Therefore, be careful chasing without the right compass combining technicals and specific support and resistance levels.
» Click here to upgrade your subscription to the paid plan
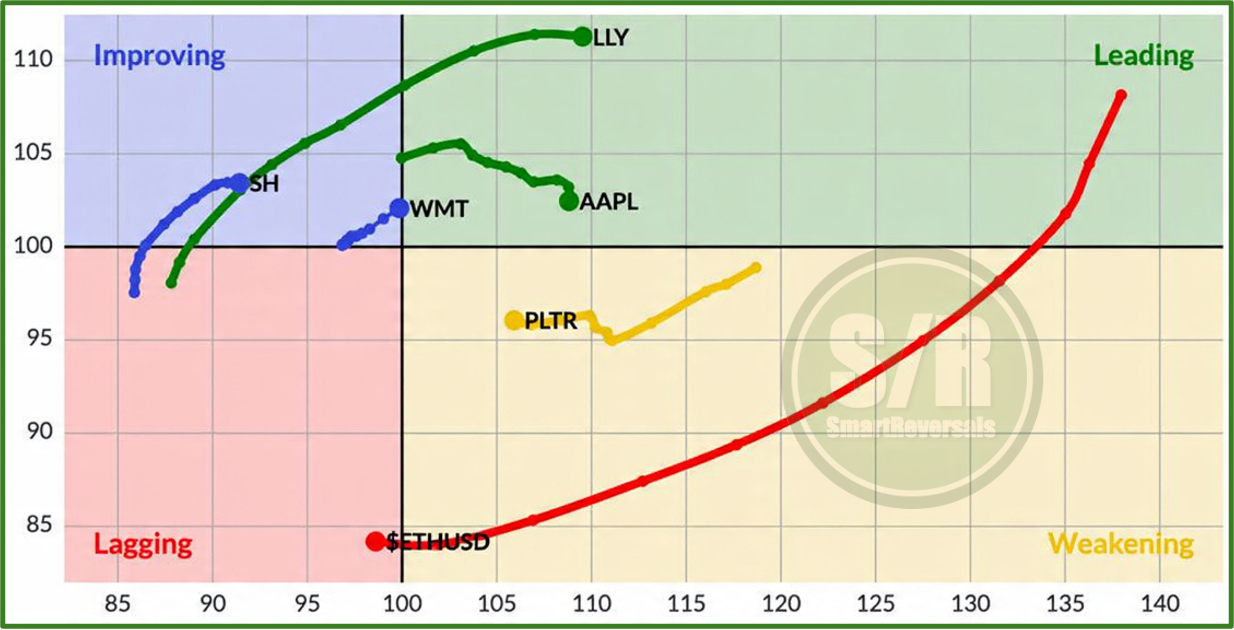
Palantir is an example of moves that are not so circular, the stock is trying to return to the leading quadrant, for that reason the technical analysis is needed.
Last but not least, SH (the inverse ETF for the SPY) is still in relative improvement, suggesting caution for the week ahead when the rate decision will be issued by the FED.
Get the actionable intelligence you need. This publication serves as a powerful resource for technical traders seeking in depth setup analysis, and as a clear guide for people who need actionable insights to manage their market capital efficiently while working their 9 to 5. Subscribe now!
This publication consistently analyzes the following securities to provide a broad market perspective and empower your trading decisions:
Indices & Futures: SPX, NDX, DJI, IWM, ES=F, NQ=F
ETFs: SPY, QQQ, SMH, TLT, GLD, SLV, DIA, SH, PSQ
Major Stocks: AAPL, MSFT, GOOG, AMZN, NVDA, META, TSLA, BRK.B, LLY, WMT, AVGO, COST, JPM, PLTR, NFLX
Crypto & Related: Bitcoin, ETH, IBIT, MSTR
Leveraged ETFs: TQQQ, SQQQ, UDOW, SDOW, UPRO, SPXS, URTY, SRTY
The Support and Resistance levels for all of those securities were posted yesterday, they can be reached here with market commentary:

In case you missed it, last Wednesday the fundamental and technical deep dive was for NVDA, MRVL, and INTC.

Unlock all the content, today we go straight to the charts and setups.
Let’s begin with the complete Momentum Map, the 9 highest probability setups (today we have long and short opportunities), the S&P 500, and the key technical charts: