
Bull Consolidating or Exhausted? - 3 Indicators to Watch
A Short Term Consolidation is Still in Play - Long Term Timeframes Suggest ATH are Coming - NVDA Fundamental Update


Yesterday, in the weekly Support and Resistance Levels edition, I provided a first overview of my investment and trading approach. This included describing various technical signs, featuring the S&P 500 monthly chart which is openly accessible (click here), I also emphasized the crucial role of Support and Resistance levels as a tool for managing emotions when executing trades, helping to prevent both premature and delayed decisions.
Today, I continue describing my investment and trading approach, which incorporates the fundamental analysis of a company, as previously posted in educational content about fundamentals (click here), The information behind the technical chart is crucial; there can be technical euphorias in stocks like GME, AMD, and others that have shown spikes inconsistent with their financials, leading to significant corrections when they occur. All the companies I analyze have been fundamentally assessed, and I provide a library of these studied companies (click here).
One of the most important events of the week that just ended was the Nvidia’s earnings report, let’s study the current company context with its technical monthly chart as an additional reference of how to combine criteria and the information provided at SmartReversals.com.

NVIDIA engineers and supplies high-performance graphics and video processing chips that are integral to a vast range of computing systems, from consumer gaming PCs and notebooks, professional workstations, and game consoles, to powerful accelerated computing servers and cutting-edge supercomputers.
NVIDIA's Data Center segment is the primary driver of its business, contributing 88% of total revenue in Fiscal Year 2025 (ending January 2025). The company's strategy extends beyond semiconductor sales to providing comprehensive end-to-end platforms. These platforms integrate GPUs, DPUs, and advanced interconnects with an extensive software ecosystem, including CUDA and NVIDIA AI Enterprise, creating a significant competitive advantage. This integrated approach is crucial for accelerating compute-intensive workloads such as AI, data analytics, and scientific computing across various deployment models including cloud, hyper-scale, and enterprise data centers. While other segments like Gaming (9% of FY25 revenue), Professional Visualization (2%), and Automotive (1%) are part of NVIDIA's portfolio, the Data Center segment largely dictates the company's growth trajectory.
A key element of NVIDIA's long-term strategy is its software layer and the expanding applications of AI agents. With over 5 million developers reported to be using NVIDIA AI Enterprise, and collaborations with Salesforce, SAP, ServiceNow, and others to develop AI agents, this area presents substantial long-term potential.
Profitability: NVIDIA is projected to maintain high EBIT Margins around 65% this figure significantly exceeds the non-NVDA Magnificent-7 average margin of approximately 19%.
Growth Projections: The company is anticipated to achieve a Sales Compound Annual Growth Rate (CAGR) of approximately 29% and an EPS CAGR of around 28% for the 2024-2027E period. These growth rates are substantially higher than the average expectations for its Magnificent-7 peers (ex-Nvidia Sales CAGR ~11%, EPS CAGR ~13%).
Balance Sheet Strength and Cash Generation (as of April 2025): NVIDIA's financial health is robust. Total cash reserves stood at $53.7 billion, with Net Cash at $45.2 billion (representing a 108.2% year-over-year increase). Free Cash Flow for the quarter ending April 2025 was reported at $26.2 billion. Working capital metrics, such as inventory days, have also shown improvement, recorded at 59 days.
Return on Capital: Capital efficiency has demonstrably improved. Return on Assets (ROA) was 57% for the 12-month period leading into early 2025, and Return on Capital (ROC) reached 71% in FY25. These represent significant increases from prior fiscal years (ROA FY24: 39%, FY23: 8.2%; ROC FY24: 47%, FY23: 9.6%).
Valuation Analysis: The PEG Ratio in Context
From a valuation perspective, NVIDIA presents a noteworthy profile. Despite a high market capitalization and elevated absolute P/E (e.g., ~25.1x for 2026 Projected) and EV/Sales (e.g., ~13.8x for 2026 Projected) multiples, NVIDIA's Price/Earnings to Growth (PEG) ratio for 2026E is estimated at 0.9x. This is notably lower than the non-NVDA Magnificent-7 average PEG of 3.0x and Google's 1.1x. This suggests that, when factoring in projected earnings growth, NVIDIA's valuation may be more favorable than its headline multiples initially imply, particularly in comparison to its mega-cap peers.
Investors should consider some risk factors:
Data Center Infrastructure Constraints: The physical build-out of data centers and access to sufficient power can act as limiting factors to deployment growth, independent of NVIDIA’s production capabilities.
Geopolitical Factors: The complex global trade environment, including restrictions on advanced technology exports to certain regions, presents an ongoing risk that could impact specific product lines or market access.
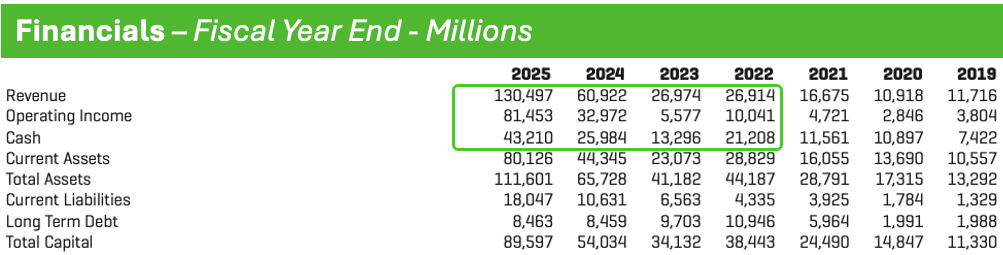
NVDA's financials reveal explosive growth, particularly post-2022. Revenue surged from $26.9B (2022) to $130.5B (2025), with Operating Income following suit, from $10B to $81.4B. Cash quadrupled from $13.3B (2023) to $43.2B (2025). This massive expansion in top and bottom lines, coupled with strong cash accumulation and manageable debt, showcases remarkable performance and increasing capital efficiency.
If you’re interested in more fundamental analysis like this one for NVDA, click the like button 🩶 even if you’re reading an email. I can post a series of fundamentals for big caps without interruption of the technical updates.
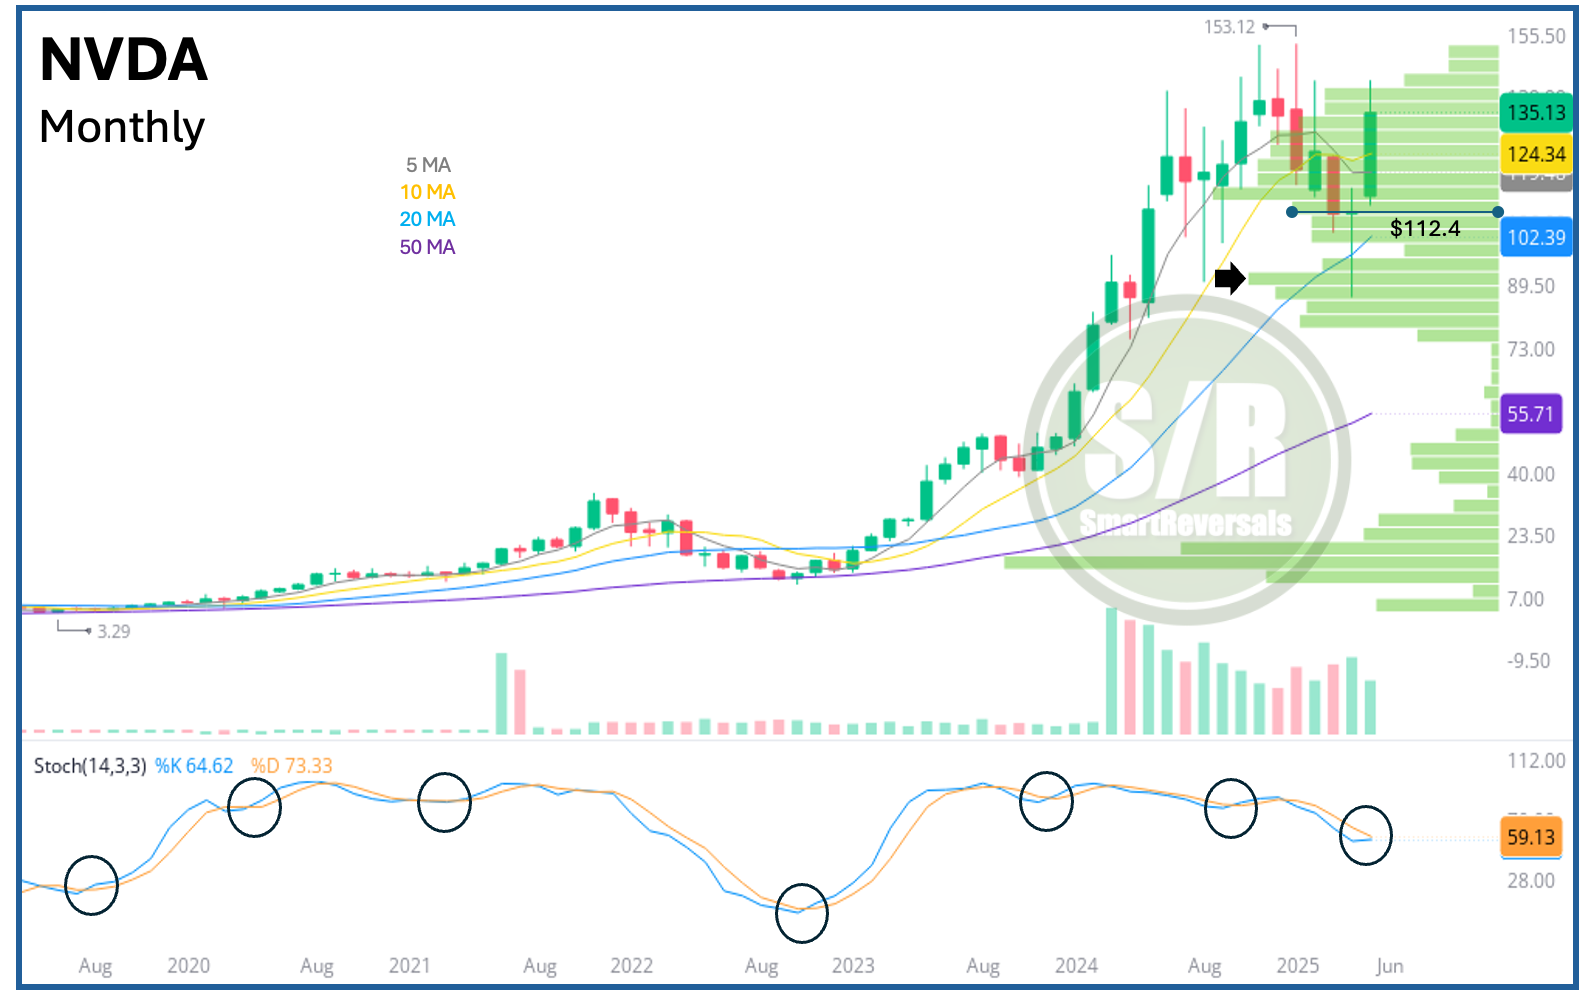
NVDA's monthly technical chart now clearly shows a breakout considering the candle and bullish crossover in the oscillator, a sign that in this long term timeframe has preceded bullish continuation as circled. This follows April's bullish dragonfly doji, which bounced from the point of control (POC) of the volume shelf that peaks at $89 as highlighted by the arrow (NVDA’s low was $87🎯), and coincided with oversold conditions on the daily and weekly timeframes as studied in this publication back then. The most recent candle further reinforces a bullish continuation for the coming months, a thesis strongly supported by the fundamentals we just examined, and the annual $112 level is set to stay in support position during all 2025.
The weekly chart, that continues below, details NVDA's price target with a short term bearish signal that may bring a better buying entry for bulls during May. The analysis below presents the short term condition to watch, the price level from where the technical conditions set bullish momentum, and the support levels (bearish targets) that may set a bullish reversal.
For educational content about the technical indicators mentioned, click on each link according to your interest: Stochastic and RSI oscillators, Candlestick patterns, Moving averages, and Support and resistance levels. Additionally, there are more indicators that I use in my regular analyses, such as Bollinger Bands, Volume Profile, and the McClellan oscillator. For the complete library, including studies of reversals and technical patterns in the stock market, click here.
If you invest in or trade any of the following securities, this publication provides you with price targets, each supported by technical charts featuring the most effective indicators for explaining their unique price action (because not all charts are the same for every security): SPX, VIX, GLD, SLV, TLT, NDX, DJI, IWM, SMH, BRK.B, PLTR, NFLX, GOOG, AAPL, TSLA, MSFT, NVDA, AMZN, and BITCOIN. Unlock three publications per week that are worth much more than the current subscription price.
The Support and Resistance Levels posted every Friday include the price layers for the securities mentioned, and others like AMD, COST, LLY, UNH, TQQQ, AVGO, DIA, SPY, QQQ, and a total of 40 securities modeled to generate levels for the week and month ahead. This approach has demonstrated its predictive power for premium subscribers for over a year.
The studies available in the educational library are a key added value for you. Last Wednesday, a revealing study on SPX gaps, based 20 years of price action, was shared. Its simplified presentation ensures easy understanding. Access here, and for the complete library, click here, that content alone is worth the subscription.
The Chat feature is utilized regularly; the breadth thrust triggered on April 24th was communicated there, as were major market moves like the one that just occurred on Monday, May 26th.

Today’s edition brings the monthly charts for NDX, TSLA, and MSFT, which has an intriguing setup that must be studied.
SPX - Consolidation or Exhaustion? 3 Indicators to Watch