


The week was characterized by strong swings in indices and individual names; geopolitical tensions intensified following U.S. retaliatory military strikes against targets in Iran in response to attacks on commercial vessels in the Strait of Hormuz, this sent global oil benchmarks soaring, with Brent crude jumping over 5% and nearing the $80-per-barrel mark. This spike in energy prices immediately reignited fears regarding persistent inflation, and when combined with Federal Reserve meeting minutes suggesting potential further interest rate hikes, the 10 year U.S. Treasury yield climbed to 4.6%, reaching its highest level since May. Later in the week the U.S. president noted that while he has agreed to continue diplomatic talks, the tentative truce has officially been scrapped; then the market recovered and some oil gains were yielded.
In response to the shifting market landscape, sector performance diverged. The weekly move in the SPX remains constructive, though tech-driven (XLK). Materials (XLB), healthcare (XLV), industrials (XLI), consumer staples (XLP), and utilities (XLU) declined while real estate remained flat with discretionary and real state. Energy performed well; XLE still has a gap to fill at 56.22 and is showing a weekly bullish stochastic crossover, suggesting further upside.
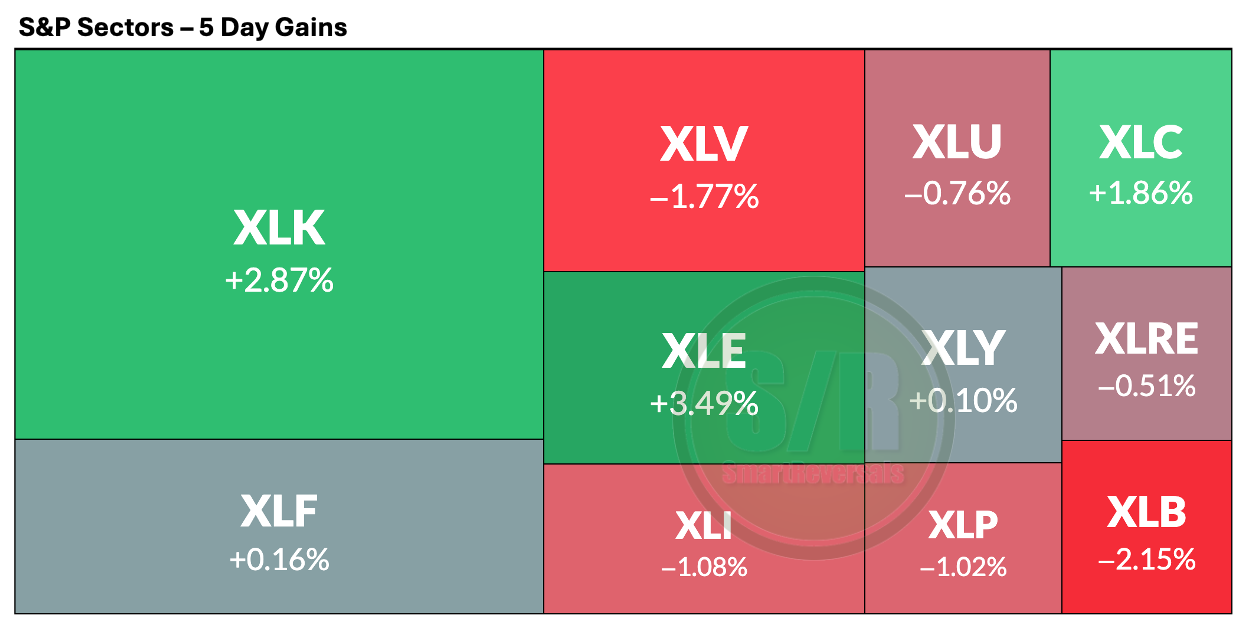
With that said, we’re back to a bullish market driven by tech (XLC as communication sector was largely driven by the rally on META). However, there are divergences in tech that I have been tracking daily in this publication:
Two weeks ago, I highlighted the bullish probabilities for the magnificent seven based on a transparent analysis of volume, back then nobody was bullish on them, but we had the technical case and the support and resistance levels to validate the thesis; MSFT 🎯, GOOG 🎯, AAPL 🎯, TSLA 🎯, AMZN 🎯, and META 🎯 rallied reseting daily timeframes, then we monitored continuation, since some of them have long term weak setups, and in fact GOOG, AMZN and MSFT presented weakness this week.
All that happened in a context where semiconductors are suffering high volatility, also as anticipated from the very day when MU posted its earnings report 🎯, trapping many people who don’t have technical or risk management knowledge.
Among other setups, two weeks ago I highlighted the validity of being long in crypto, BTC and ETH have rallied +6% and +15% respectively 🎯.
A more recent call included the bullish one for NVDA, once our central Weekly Level (CWL) of 195 was conquered 🎯. These assessments have been based on technical indicators transparently described, providing specific price targets and invalidation levels to use as a reference for setting stop losses.
This level of specificity is the hallmark of this publication; it is easy to suggest that crypto or metals might bounce over the course of several months, but providing concrete, actionable levels is where the real value lies.
That level of specificity facilitates transparency. For this week, an invalidated setup was NFLX, a stock that is analyzed below with specific indicators, price levels and scenarios considering the earnings report that is coming next week.
Unlock this objective approach by upgrading to our premium plan. Subscribers gain access to exclusive educational content, Market Intelligence reports, and daily market updates featuring daily support and resistance levels for the SPX for the following trading session.
Explore the content at smartreversals.com. Zero gut feeling, everything is specific.
Today’s Agenda
Market Context: Charts+levels for SPX, Indices, ETFs, VIX, Breadth, and Crypto.
Deep Dive: Individual analysis with charts and targets for Mag Seven and setups.
Momentum Map: Analyzing the stage of every security in a single view.
Setups Blueprint: Entry levels for short and long setups with price targets and invalidation levels for all the securities in the watchlist prioritizing stronger setups.
Let’s begin.
SPX: Once Again Dependent on Tech
The index achieved a bullish resolution, hitting our weekly target of 7,566. Looking ahead to next week's outlook and targets, please remain mindful of the significant decline in this specific indicator; it is the primary divergence to monitor, and it is important to note that it is not an oscillator: