

The stock market experienced choppy, indecisive price action in the SPX and ES Futures struggled under the weight of surging bond yields. For most of the week, the 10-year Treasury yield surged as high as 5.35% early Thursday to set a fresh 24 year high, while the 30-year yield touched 5.62%, the highest level since 2002. This bond sell-off was fueled by a combination of fears that a resilient economy would keep interest rates higher for longer and escalating conflict involving Iran.
Mid-week data kept investors on edge by presenting a mixed economic picture. The August Personal Consumption Expenditures (PCE) price index showed cooling inflationary pressures at 3.4% year-over-year, while second-quarter GDP was revised upward to a robust 2.2% annualized growth rate, increasing the odds of a rate hike.
The narrative flipped on Friday following the release of September’s nonfarm payrolls report. U.S. employers added just 29,000 jobs, significantly missing the Dow Jones consensus estimate of 84,000. While the unemployment rate ticked up to 4.2%. Although this pointed to a slowing labor market, Wall Street welcomed the news as a sign that the Federal Reserve will likely stay on hold in October, triggering a steep retreat in Treasury yields and a major relief rally across the major indices. As of today the probability of a rate hike sits at 20%… one week ago it was at 64%.
During the week, the SPX traded inside a weekly range between 7,709 and 7,609, as a spike in the Volatility Index kept the index below its key weekly level of 7,609. The VIX jumped 10% through yesterday, and I noted in yesterday’s daily update: “There are chances for the VIX to decline tomorrow given today’s intraday reversal.” This daily retrace in the VIX (and subsequent bounce in the SPX) remains part of a broader macro move analyzed yesterday that still warrants caution.

Staying within their respective level ranges, QQQ oscillated between a Monday bottom of 732 and an upper zone of 752 today, while the semiconductor ETF (SMH) traded between 598 and 629. Every single one of these levels was modeled in advance last week, proving how effectively they frame price action and map out where institutional algorithms are likely to react.
Every Friday I model the levels for the week ahead for over 30 securities these levels provide the information needed to assess risk and reward before the market opens on Monday. You don’t have to wait for the opening bell to decide your plan and which securities to trade; you have here the distances to essential levels and the setups suggesting whether they will act as support or resistance well in advance, so you make informed and serene decisions well ahead of the opening bell.
The Weekly and Monthly Levels are Modeled for this Watchlist:
Indices & Futures: SPX, NDX, DJI, IWM, ES=F, NQ=F
ETFs: SPY, QQQ, SMH, TLT, GLD, SLV, DIA, VXX
Major Stocks: AAPL, MSFT, GOOG, AMZN, NVDA, META, TSLA, SPCX, LLY, WMT, AVGO, COST, JPM, XOM, PLTR, NFLX, V, AMD
Crypto & Related: Bitcoin, Ethereum, ETHA, IBIT
Leveraged ETFs: TQQQ, SQQQ, UDOW, SDOW, UPRO, SPXS, URTY, SRTY
Today’s Content:
E-mini Futures: Analyzing the Structure Signaling Caution
Weekly Levels for the Watchlist
Monthly Levels for the Watchlist
Combined Levels
Daily Plan for Monday (SPX and ES=F)
ES=F: Analyzing the Structure
During these days I like to emphasize that I have been bullish since the end of March (in the middle of the panic) as I was in 2025 since April. When technicals suggest bullish price action or a major bounce I navigate accordingly, when the structure shows cracks I am neutral and anticipate them so you can manage your risk while navigating the market.
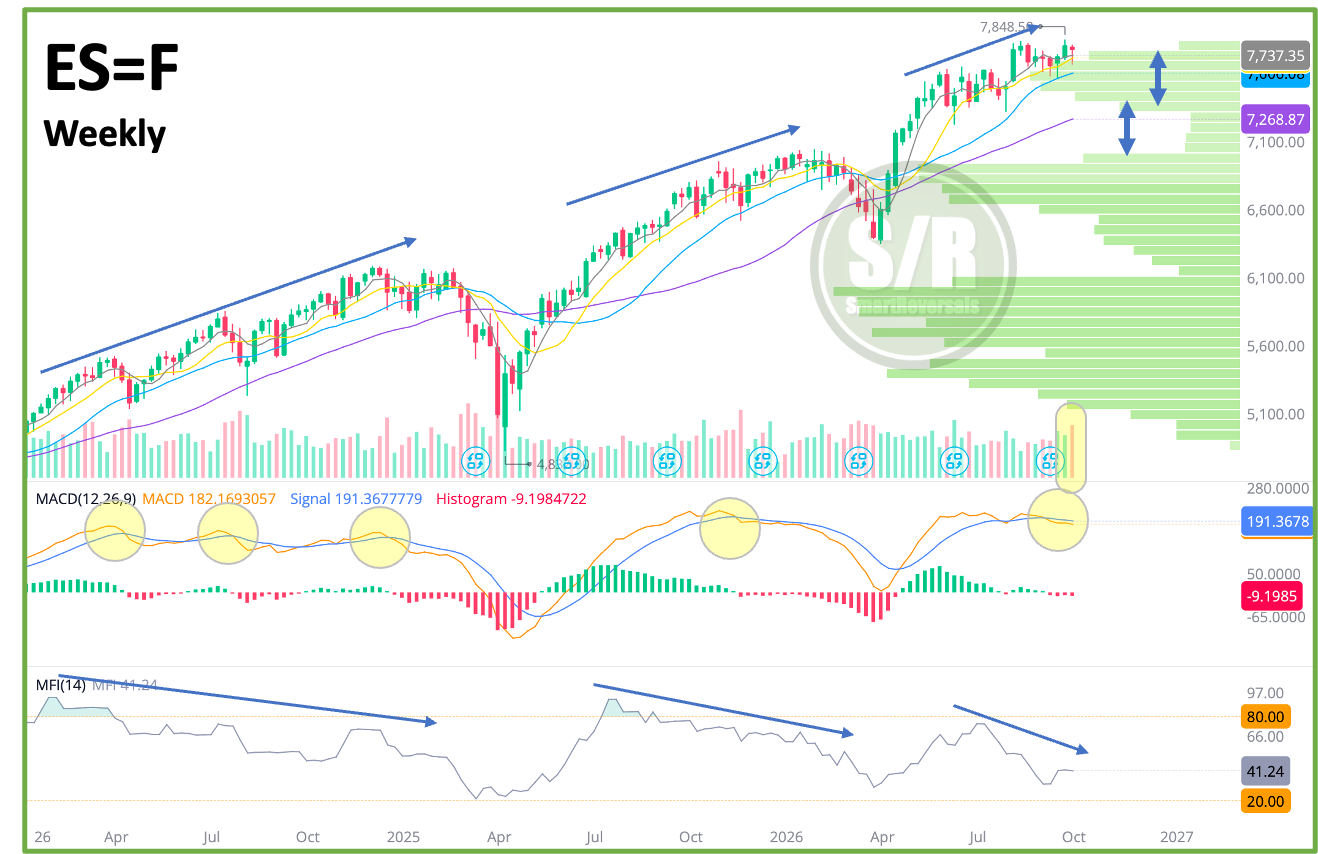
The chart may be self explanatory, considering the divergences that have preceded pullbacks and corrections, anyway let’s study the indicators and assess the most relevant elements including the different volume perspectives plus the weekly and monthly levels that must be watched since a loss of them can trigger a significant decline: