
Bulls Defend Ground, Bears Keep Pushing
How Sustainable Is a Stock Market Rally Based on Rate-Cut Prospects and Negative Economic News?


Non-farm payroll and ADP numbers are crucial indicators for understanding the health of the U.S. economy and the labor market, the figures released were negative during the week, so it’s worth noting that a significant and consistent decrease in these numbers is considered a very important and delicate pattern since it can signal major shifts.
A downturn in these figures indicates that companies are hiring fewer people or, in some cases, laying them off. This suggests a slowdown in economic activity. When fewer people are employed, consumer spending—a primary driver of economic growth—tends to decline, creating a self-reinforcing negative cycle. This can put the economy on a path toward recession. When people are concerned about job security, they become more cautious with their spending and saving. A downturn in non-farm payrolls a critical leading indicator of future economic weakness.
A weakening labor market can give the Fed justification to lower interest rates. The "bad news is good news" pattern is a common market reaction to this. For that reason, when the poor jobs reports were released on Thursday and Friday (and even the JOLTS on Wednesday), the market rallied on the expectation that the Fed will cut rates to stimulate the economy. Be aware that the "risk-off" sentiment comes when investors fear a recession, in the past it happened days or weeks after the rate cuts.
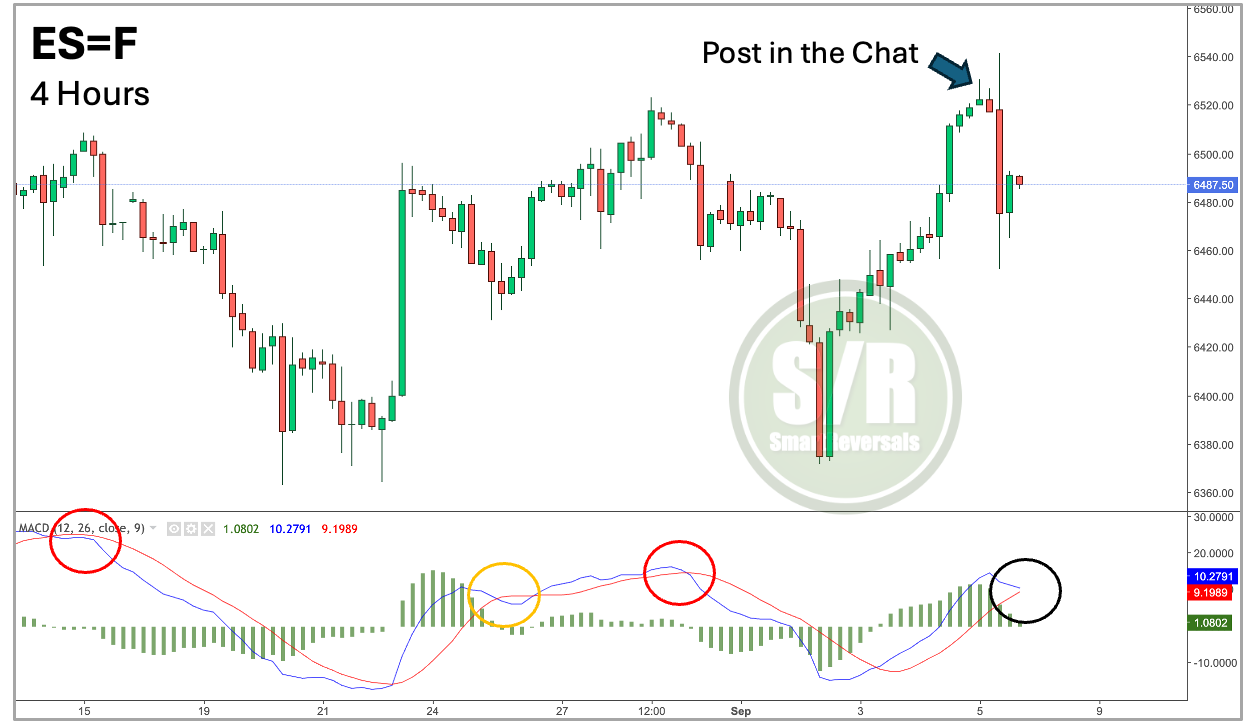
It’s worth noting that after the bullish reaction on Friday, there was a bearish reversal in price action, I alerted in the chat and in my open feeds about this reversal candle around 8AM EST on Friday, the bearish follow through was not surprising and a MACD cross would signal more bearish continuation.
Futures are the main instrument for many traders, for that reason my weekly and monthly support and resistance levels include the ES=F, and NQ=F. Get access to the ones for next week. Click here.
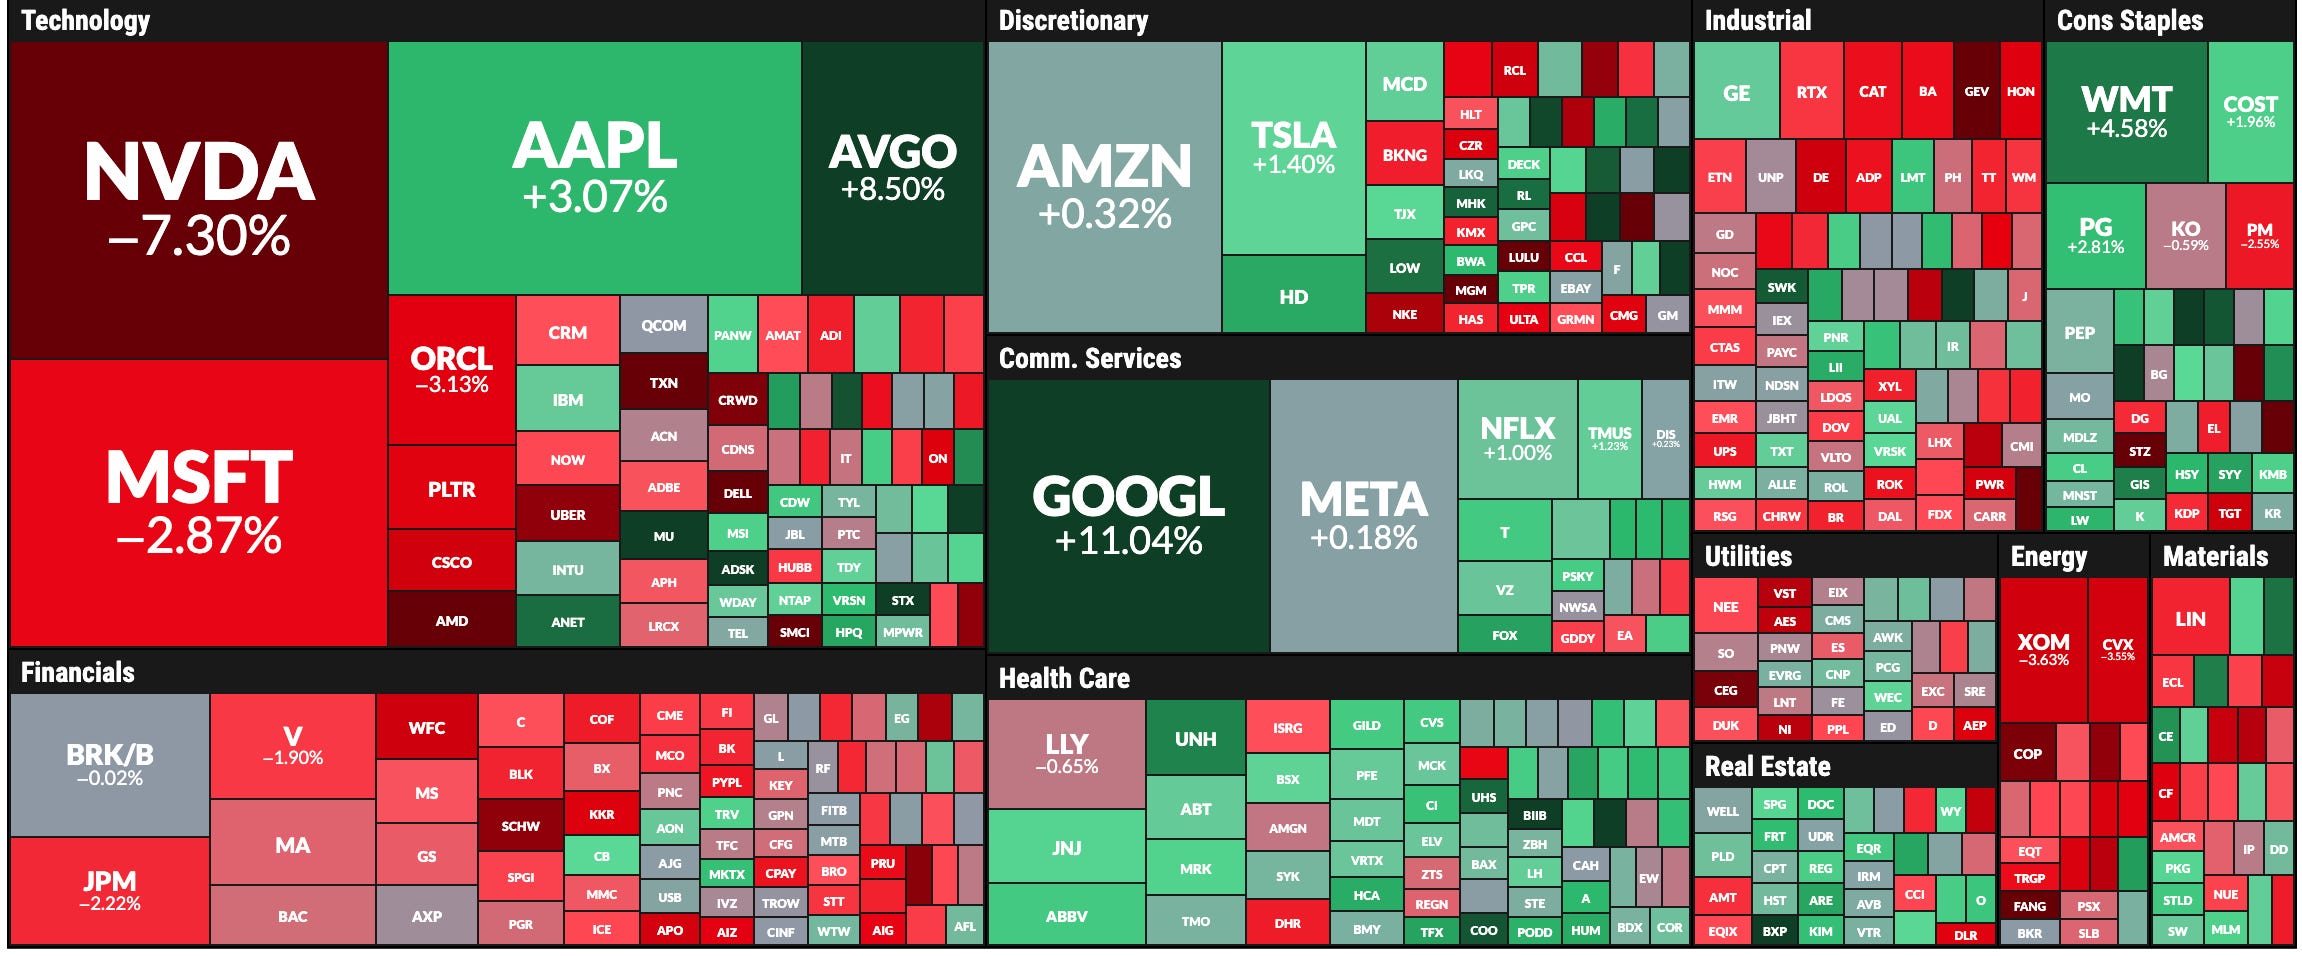
During the week, specific giants came to the rescue, especially GOOG and AAPL on Wednesday, followed by AVGO, ORCL, and TSLA on Friday. I've been bullish on GOOG and AAPL for the past weeks, and just last Wednesday, I highlighted how solid AVGO was in my fundamental publication. My bullish target for AVGO was reached, driven by its strong earnings report.
The question now is: what happens next week when these giants consolidate their moves? GOOG won't jump 9% in a day next week, nor will AVGO. Instead, they will likely return to their Bollinger range. Given Friday's bearish reversal in the SPX after the spike from the weak jobs report, it's wise to consider the potential risks that must be managed.
Let's continue with the charts for SPX, VIX, NDX, DJIA, IWM, SMH, SLV, GLD, WMT, BRK.B, NFLX, PLTR, GOOG, AAPL, TSLA, NVDA, META, MSFT, AMZN, BITCOIN, and our breadth analyses for the indices. This publication consistently analyzes with technical indicators and price levels these 20 securities to provide a broad market perspective using high grade securities.
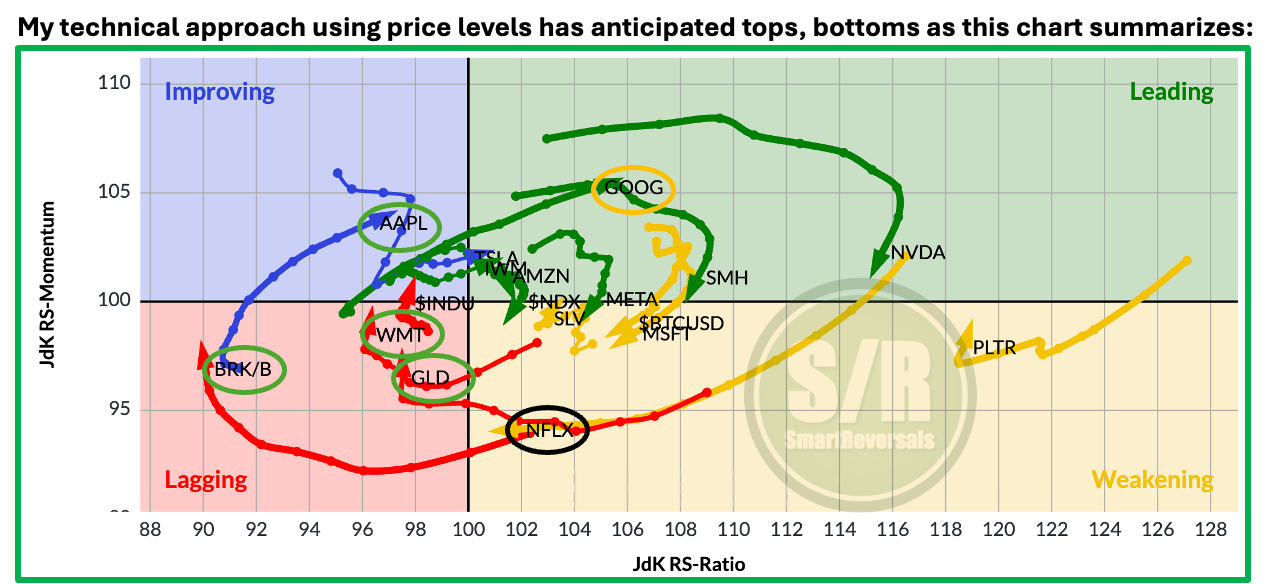
The rotation chart below shows how these securities are moving differently. Paid subscribers know that I called a top formation for Bitcoin, PLTR, MSFT, and NVDA four weeks ago. Conversely, I have been bullish on BRK.B, AAPL, GLD, and GOOG for four weeks as well, raising green flags in previous publications based on their bullish reversal setups. Today, as usual, we will analyze all of them individually with their indicators and price levels. We will also assess SMH, NFLX, NVDA, AMZN, META and the indices SPX, NDX, DJIA, IWM; to determine if the recent bounce is sustainable for some or all of them, or simply part of a larger consolidation.
Given the proven value of analyzing a variety of megacaps, WMT has been included since it is one of the biggest companies in the SP500, replacing TLT on the charts. TLT will still be covered in the support and resistance levels analysis where there are 44 securities analyzed including LLY, AVGO, AMD, JPM (added for the same reasons than WMT), MSTR, COST, IBIT, ETH, and leveraged ETFs.
Visit my market research and educational content, which includes special studies on market tops, breadth signals, and market overextensions. The collection also covers options, technical indicators, Elliott wave, fundamental analysis, trading psychology, and macroeconomics. Premium subscribers appreciate the approach of learning with fresh, relevant charts, so I have gathered the entire collection that is constantly updated in the following guide:

Let's continue our deep dive into technicals and price targets. Next week, the conversation will shift to inflation, with the Producer Price Index (PPI) released on Wednesday and the Consumer Price Index (CPI) on Thursday. Let's be prepared.
SPX
During the last five trading days, the major players have printed mixed signals, the bullish ones are more rare than the bearish ones in terms of the magnitude of the move, hence my observation about expecting again a +9% move in a giant next week sounds unlikely in a context of overbought stock market conditions.
The S&P 500 chart below shows technical conditions that are essential for market timing. We'll also examine five other key indicators that can help you validate your setups next week: