
Bulls' Final Stand
Tech Fatigue and Overbought Rotation Trade - High Probability Setups for Next Week

The U.S. stock market faced a stark reality check this week as the tech-heavy Nasdaq failed to recover. Despite strong top-line numbers from several sector leaders, the “billions in Capex” narrative has begun to sour, with investors questioning the immediate ROI on massive AI infrastructure spending. This skepticism has led to a decisive reversals for MSFT, META, AMZN, and GOOG which struggled under the weight of high expectations. As the tech engines stalled, the broad market was left without its primary growth driver, ultimately causing the S&P 500 to breach its Central Monthly Level and approach the bearish scenario target for the week: $6,810.
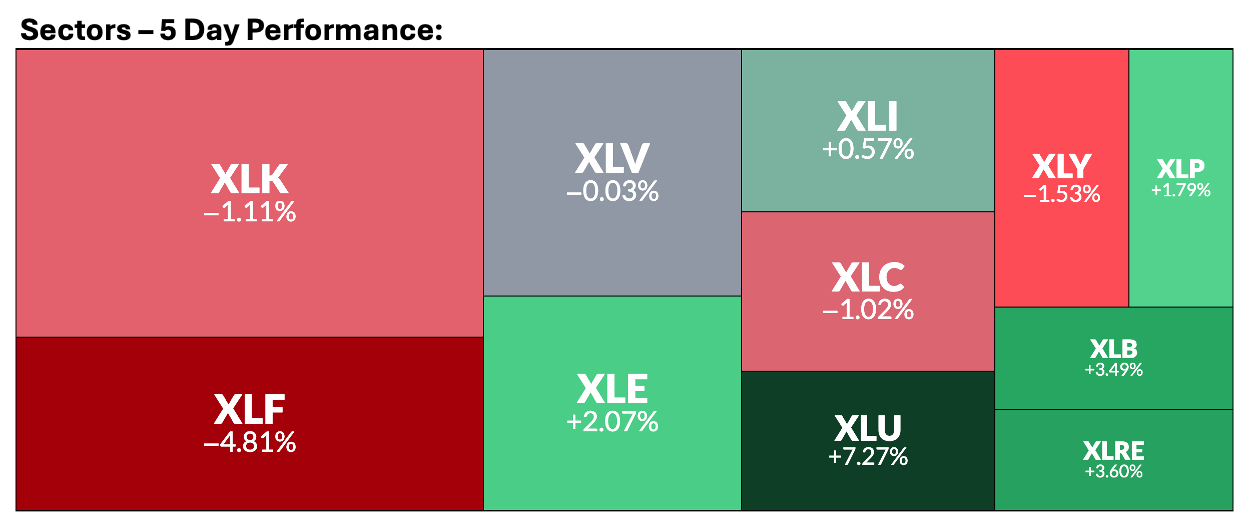
Simultaneously, the much-anticipated rotation into the “real economy” has pushed defensive sectors like Utilities, Energy, and Staples into overbought territory. While capital fled the volatility of Silicon Valley, it crowded into these value-oriented sectors, driving technical indicators to extremes and stretching valuations beyond historical norms. This week’s price action suggests that the “safety trade” is becoming increasingly expensive, leaving investors with few places to hide. With Bitcoin trying to consolidate after the recent selloff and the VIX reclaiming 20, the market is currently caught between a tech sector that is losing its lead and a real economy that is struggling to justify its recent premium.
Navigating Volatility Finding Winners
Our High-Probability Setups outperformed again in a very volatile week, maintaining a cumulative accuracy record. The setups were posted with specific targets:
🎯 MSFT reached its target of 423.8 for a +5.7% from our trigger or entry point.
🎯 AVGO reached its target of 349.4 for a +5% move.
🎯 GOOG was bearish as anticipated reaching 303.9 for a -6.1% move
🎯 IWM reached its target of 268.8 for a +1.4% move.
✅ PLTR bearish as anticipated for a -3.3% weekly move. Target in progress.
🎯 COST Choppy price action triggering $978 on Wednesday. $1,024 for a +2.3% move reached.
❌ BRK.B Stopped, breached its Central Weekly Level -1.7% and did not recovered it.
❌ META Invalidated, the week opened below the trigger, any attempt on Monday when it was slightly recovered, the price vanished afterwards.
Six out of eight setups were successful for a 75% success rate, and the cumulative since November sits at 79%. Setting the price targets and invalidation levels are based on technical indicators and modeled Support and Resistance levels for each week and month.
These educational publications present how to manage the high probability setups, upgrade your subscription and unlock this valuable guides:
Join the paid plan today to trade with institutional-grade precision.
My focus on megacaps is rooted in deep fundamental analysis, allowing us to understand the business context driving every oversold or overbought chart. You can access our latest fundamental updates for eight of the companies we watch here:
By mastering a constant universe of ‘Megacaps’ and Indices, you can identify capital rotation and time your entries with precision, rather than chasing random tickers.
Our Core Watchlist:
Indices & Futures: SPX, NDX, DJI, IWM, ES=F, NQ=F
ETFs: SPY, QQQ, SMH, TLT, GLD, SLV, DIA, SH, PSQ
Major Stocks: AAPL, MSFT, GOOG, AMZN, NVDA, META, TSLA, BRK.B, LLY, WMT, AVGO, COST, JPM, PLTR, NFLX, XOM
Crypto & Related: Bitcoin, Ethereum, ETHA, IBIT
Leveraged ETFs: TQQQ, SQQQ, UDOW, SDOW, UPRO, SPXS, URTY, SRTY
Today’s Agenda
The Momentum Map: Analyzing the stage of every security in a single chart.
Setups Blueprint: High-probability trades and full universe analysis (track your favorites).
Market Context: Technical charts and price levels for U.S. Indices, Volatility, and Bitcoin.
Deep Dive: Individual analysis of Metals and Mega Caps.
Let’s continue, my two eBooks on Essential, and Advanced Technical Indicators are below to download.