

U.S. stocks experienced a turbulent, bruising week of trading. Despite a relief bounce on Friday, all three major U.S. stock indexes posted weekly losses.
The SPX declined following a high probability setup posted last weekend, the index lost on Monday the anticipated Central Weekly Level (CWL) of 7,773. The CWL has proven to be a key threshold to define bullish conditions when the price is above it, or bearish conditions when the price is below it. The bearish destinations modeled in advance for this week were 7,729, 7,673, and 7,630. All of them worked as levels that framed this week’s action, with 7,729 acting as resistance on Wednesday, 7,630 acted as support zone on Thursday, and by Friday 7,673 was the key zone for the bounce, with the SPX closing just one dollar above it at 7,674.
Let’s Study a Chart with and Without Levels:
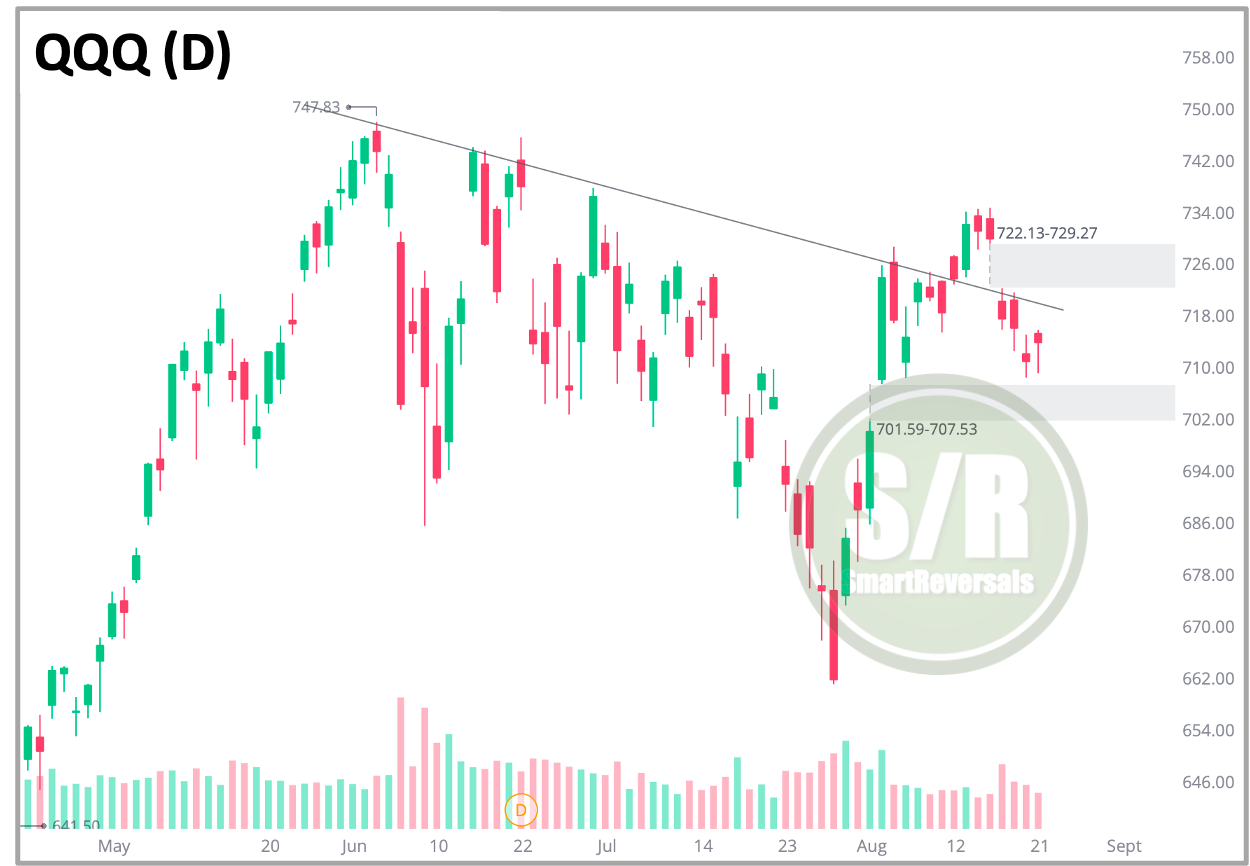
The NDX ETF QQQ shows today a loss of the diagonal that was recovered last week, suggesting a false breakout and potentially a gap fill in progress, with the price aiming at 701.5. But let’s see the chart below with monthly levels.
Same chart with Monthly Levels:
The CML is a key line that when lost the price usually gains bearish velocity, and very important, the layers below become bearish destinations as indicated by the blue arrows on the same chart, sometimes the first support works as it was the case in June, sometimes the second one is reached as it happened with precision in July.
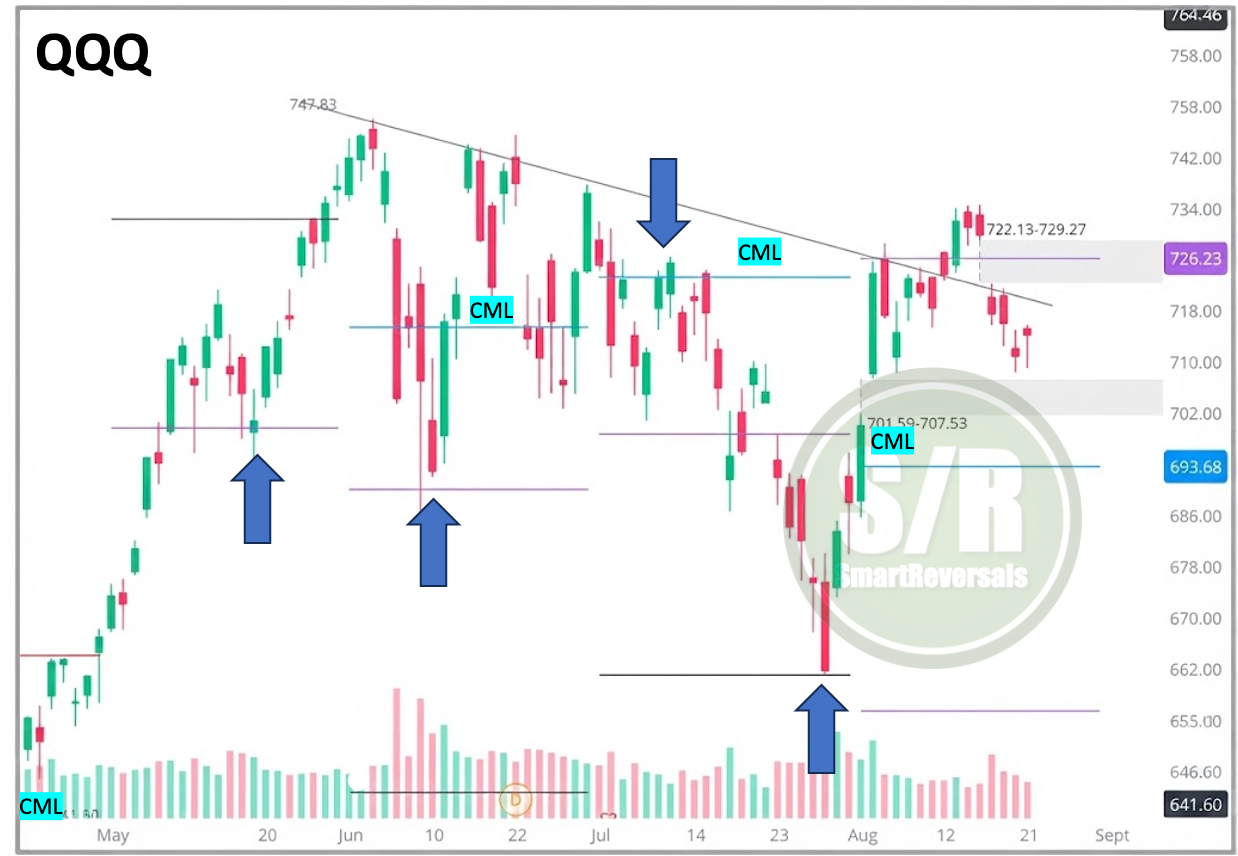
Having these levels help to anticipate zones where institutional algorithms are likely to react. This example is for the monthly levels that are relevant for longer term investors and traders.
Let’s Explore the Weekly Levels for the SPX:
For swings and shorter-term trades in general, and probably for instruments using leverage, the weekly levels are key, they help traders to navigate the monthly levels that are wider, so gains, and mostly losses, demand levels with a narrower range.
The levels for the SPX modeled last Friday included the CWL at 7,773 with a set of bullish and bearish layers. Technical indicators suggested a bearish move as I wrote in the Weekly Compass, the CWL was breached so the bearish levels came in play.
See the chart WITHOUT levels, and the same price action for the week WITH weekly levels, see how 7,729 acted as resistance on Wednesday, 7,630 as support area, and 7,673 as the area where the price closed. The way how institutional algorithms react is impressive.
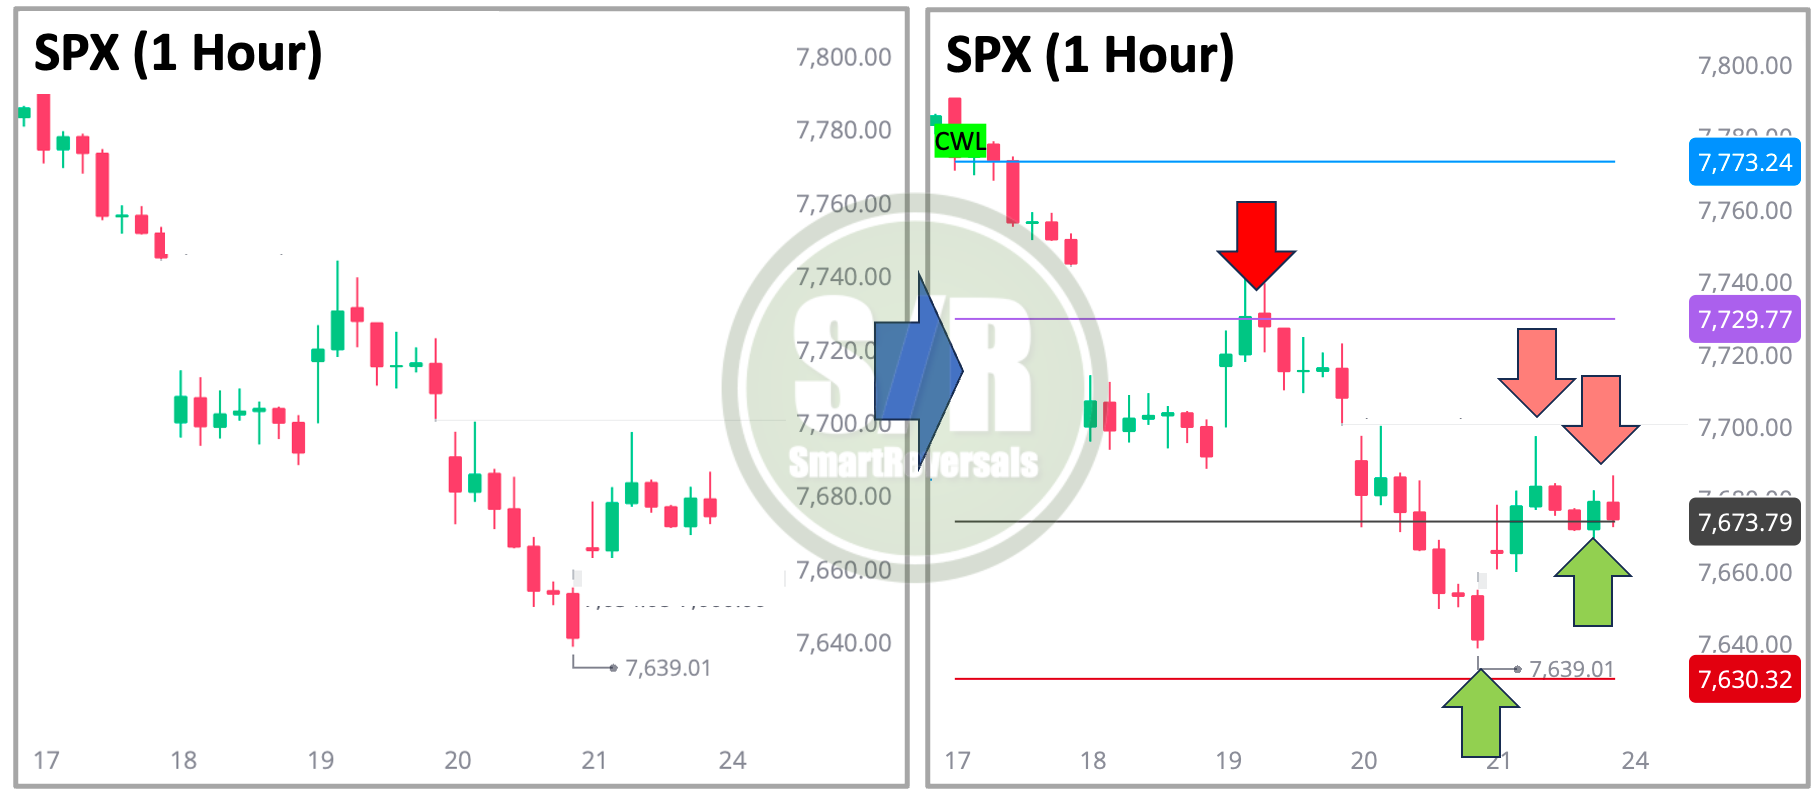
These Monthly and Weekly levels are modeled every Friday for you, providing the information needed to assess risk and reward before the market opens on Monday. You don’t have to wait for the opening bell to decide your plan and which securities to trade, so you make informed and serene decisions ahead of Monday morning, not rushing that morning. The levels are generated for our core watchlist:
Indices & Futures: SPX, NDX, DJI, IWM, ES=F, NQ=F
ETFs: SPY, QQQ, SMH, TLT, GLD, SLV, DIA, VXX
Major Stocks: AAPL, MSFT, GOOG, AMZN, NVDA, META, TSLA, BRK.B, LLY, WMT, AVGO, COST, JPM, XOM, PLTR, NFLX, V, AMD
Crypto & Related: Bitcoin, Ethereum, ETHA, IBIT
Leveraged ETFs: TQQQ, SQQQ, UDOW, SDOW, UPRO, SPXS, URTY, SRTY
Unlock the levels for next week, price action continues weak. When you subscribe to the paid plan, you also receive daily levels for the SPX and ES=F with a market update.