
CPI Fueled Stock Market Rally, Bearish Signals Ignored by SPX and NDX, not by DJI and Small Caps
Strong fundamentals and falling interest rates have further fueled the tech rally. However, other sectors are not exhibiting the same bullish momentum.


SPX to the moon!.. Right?
CPI gave a bullish direction to the stock market this week. The news was so positive that overbought oscillators and Bollinger Bands seemed meaningless to price action. Remember a similar situation not long ago when NVDA soared, and I mentioned that its exceptional revenue growth (over 260%) mirrored the stock's remarkable rise.
I devised a special publication for everyone (free), providing charts related with the latest inflation report and other elements that must be considered for any investor and trader, you can read it in this link:

In addition to a good inflation report, Apple (AAPL) satisfied the market with its AI projects. The not long ago “sleepy king," awoke and soared, reaching exactly $219 – the bullish target anticipated last week.
SPX and NDX did not move as expected, but Bitcoin, DJI, IWM, DXY and Crude Oil did, the first two avoided turbulence for two reasons: Big Tech and interest rates (TNX).
TNX and Big Tech Drive Rally in SPX and NDX
The weight of large tech mega-cap companies in the S&P 500 (SPX) and Nasdaq 100 (NDX) is significant enough to drive these indexes.
Every weekend, I update my favorite and easiest to understand breadth indicator for paid subscribers. This week, I'm adding two additional data points:
The equal-weighted S&P 500 index closed the week down 0.57%, while the S&P 500 itself closed up 1.58%.
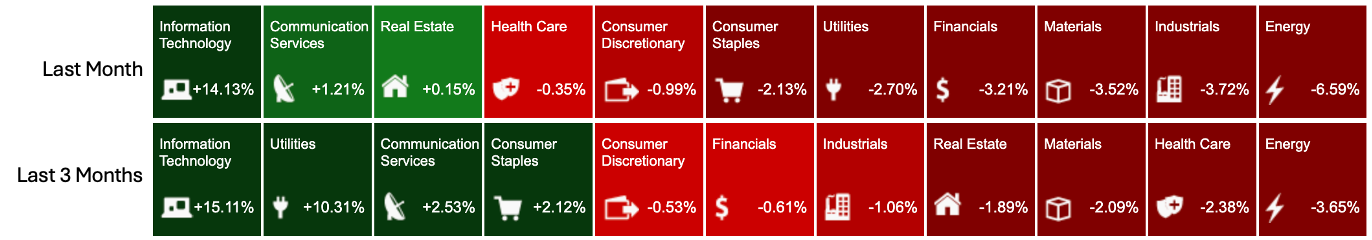
Sector performance within the S&P 500 shows notable strength in technology over the past three months, with most other sectors in negative territory; the situation is worse for the last month.
While tech mega-caps hold significant weight in major indexes, their strong fundamentals alleviate concerns. The market is rewarding these companies for factors like revenue growth, profitability, market share, and overall competitiveness – a stark contrast to the dot-com bubble.
However, overextended technical indicators present a potential challenge. Both the mega-caps and the indexes have reached bullish targets quickly. Remember, I projected $5110 for the S&P 500 six months ago, and just last month added a further target of $5450. Both were reached swiftly.
These same mega-cap companies that fueled the rally are expected to see a deceleration in earnings per share growth. Since the stock market is a forward-looking mechanism, this deceleration, coupled with overheated technicals, could lead to market turbulence. It's important to note that deceleration doesn't necessarily translate to bad earnings reports.
Mi position is bullish, last week I shared an Zweig breadth trust analysis as a reference of the current market, my support levels have been way above most analyst’s, and last week the central S/R levels were not even touched by the two big indexes (SPX and NDX), my concern is the velocity of the moves.
Now more than ever, those S/R levels have to be considered, since accelerated bullish moves can be followed by accelerated declines, the levels published yesterday have a graphical example for SPX of how important the central weekly level is.
SP500 and Nasdaq reached their second annual S/R level, here are the key points to consider for the week ahead, let’s start the chart immersion.
SPX