Cracks Beneath the Market's Surface
While stocks surge, technical indicators including a poised VIX warn of potential turbulence ahead - Key levels to watch during this busy earnings week
The inauguration gave markets a boost, and the bullish setups shared last Saturday played out as expected for IWM, SMH, SPX, TLT, NDX, DJI, PLTR, and Bitcoin. GLD and SLV, while anticipated to consolidate, jumped higher, not before triggering their central levels which were provided as a tool for bullish validation. NVDA continues its expected consolidation, the DXY reversed bearishly as predicted, hitting its $107 target perfectly, and natural gas also declined as anticipated. Key ranges studied last week held strong for TSLA.
AAPL, surprised by heading south instead of consolidating as expected. AMZN, MSFT, and META triggered their bullish signals crossing above their central levels. This underscores the importance of support and resistance (S/R) levels for effective risk management.
That's a solid directional accuracy rate, 14 securities moved as anticipated, and the four which didn’t still acted within the weekly S/R levels, triggering signals when crossing the central S/R level and then: reaching the second resistance (META, AMZN, and MSFT), or the second support (AAPL). Trading is about reading the setups and setting price levels to validate them and taking decisions, that’s why the levels are key. The ones for next week are here:
Today, the IWM and SMH analyses are open for everyone, offering a glimpse into the premium content. Let's examine how the S/R levels performed for these two.
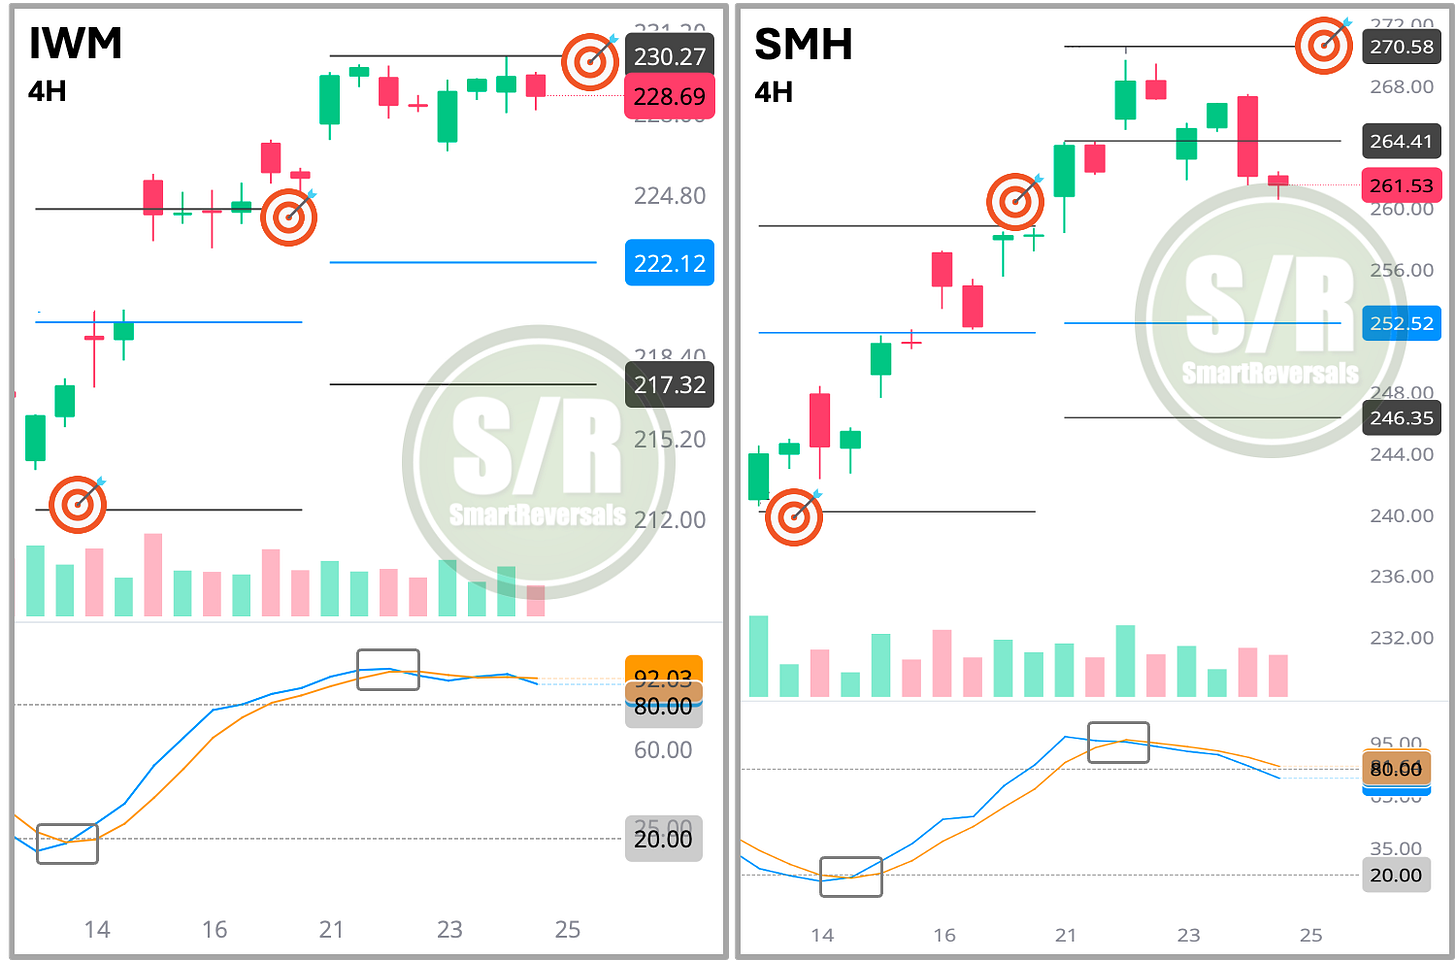
IWM bounced last week from the bearish target provided the previous Saturday (first target icon), even reaching the bullish target also outlined that same week (second target icon). Last Saturday, I noted the bounce's underlying weakness, suggesting a cautious bullish setup with a target of $230.2. Price action was rejected precisely at that level (third target icon).
SMH, also available to all readers, rebounded last week from the bearish target shared beforehand (first target icon), and the bullish target was also reached with remarkable precision (second target icon). This week, I anticipated a further push before a pullback. Price surpassed the initial target of $264, continuing to the next $270 level with equal accuracy. The S/R levels provides different levels of support and resistance.
Let’s study the updated analysis for next week:
IWM
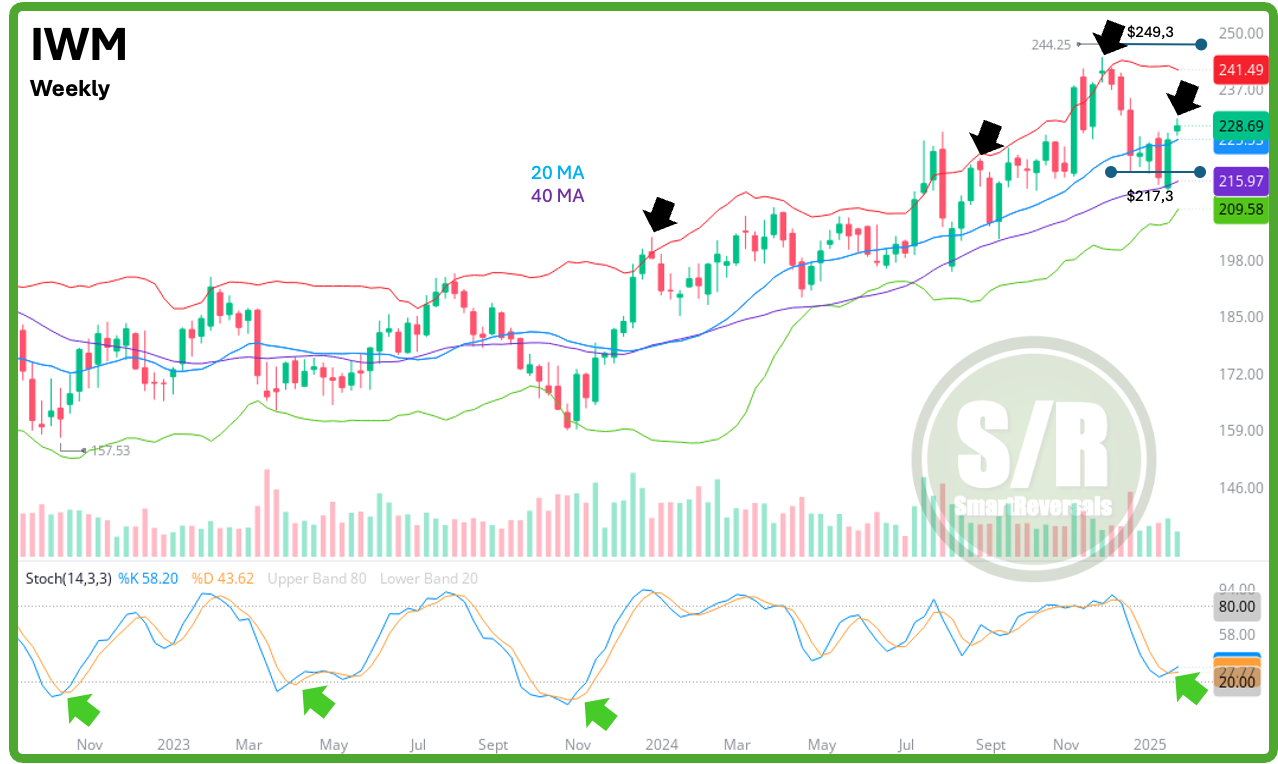
Setup: The prognosis last week was “cautiously bullish” and today it is a likely bearish reversal.
Considering: Weekly evening stars have provided confirmation as highlighted by the black arrows, this time price action is not at the higher Bollinger band (which would provide a guaranteed bearish reversal), but the daily chart is quite weak, with the weekly S/R level provided last week as target ($230,3) dictating the rejections. Since price is above the 20MA, and the Stochastic has also proven to be a reliable signal, the expectation is a choppy price action similar to April 2023 as highlighted by the second green arrow.
Bearish confirmation if price breaks below this key level: $228.5
Immediate target for bearish continuation: $226.7 (-1.5%)
Potential bullish reversal target if the key level is recovered: $230.4 (+0.8%), and if that level is crossed we would be talking about $232 (+1.5%), but as of today risk reward doesn’t look good for long positions.
SMH
Setup: Bearish
Considering: Shooting stars have proven their worth anticipating bearish moves, one thing in favor of bulls is that price is not overbought relative to oscillators, but the clash with the higher Bollinger band builds on the bearish thesis.
Bearish confirmation if price stays (day or 4H) below this key level: $263.2
Immediate target for bearish continuation: $256.8
Potential bullish reversal target if the key level is recovered: $268
SMH resembles the NVDA chart, with comparable tops, and that stock is also giving clues of a bearish reversal coming, the complete analysis for NVDA with levels and other indicators is in this publication.
This publication covers the following securities every Saturday: SPX NDX DJI IWM SMH TLT NVDA META MSFT AMZN GOOG AAPL TSLA PLTR GLD SLV NAT GAS and BITCOIN. If you trade some of them, this publication is for you and you.
More securities and indices are studied in Wednesdays and Fridays editions.
Let’s continue.
SPX


