
Cracks Under the Surface
Will Earnings Season Reverse the Weakening Technical Structure?

Discipline, Precision, and Market Neutrality
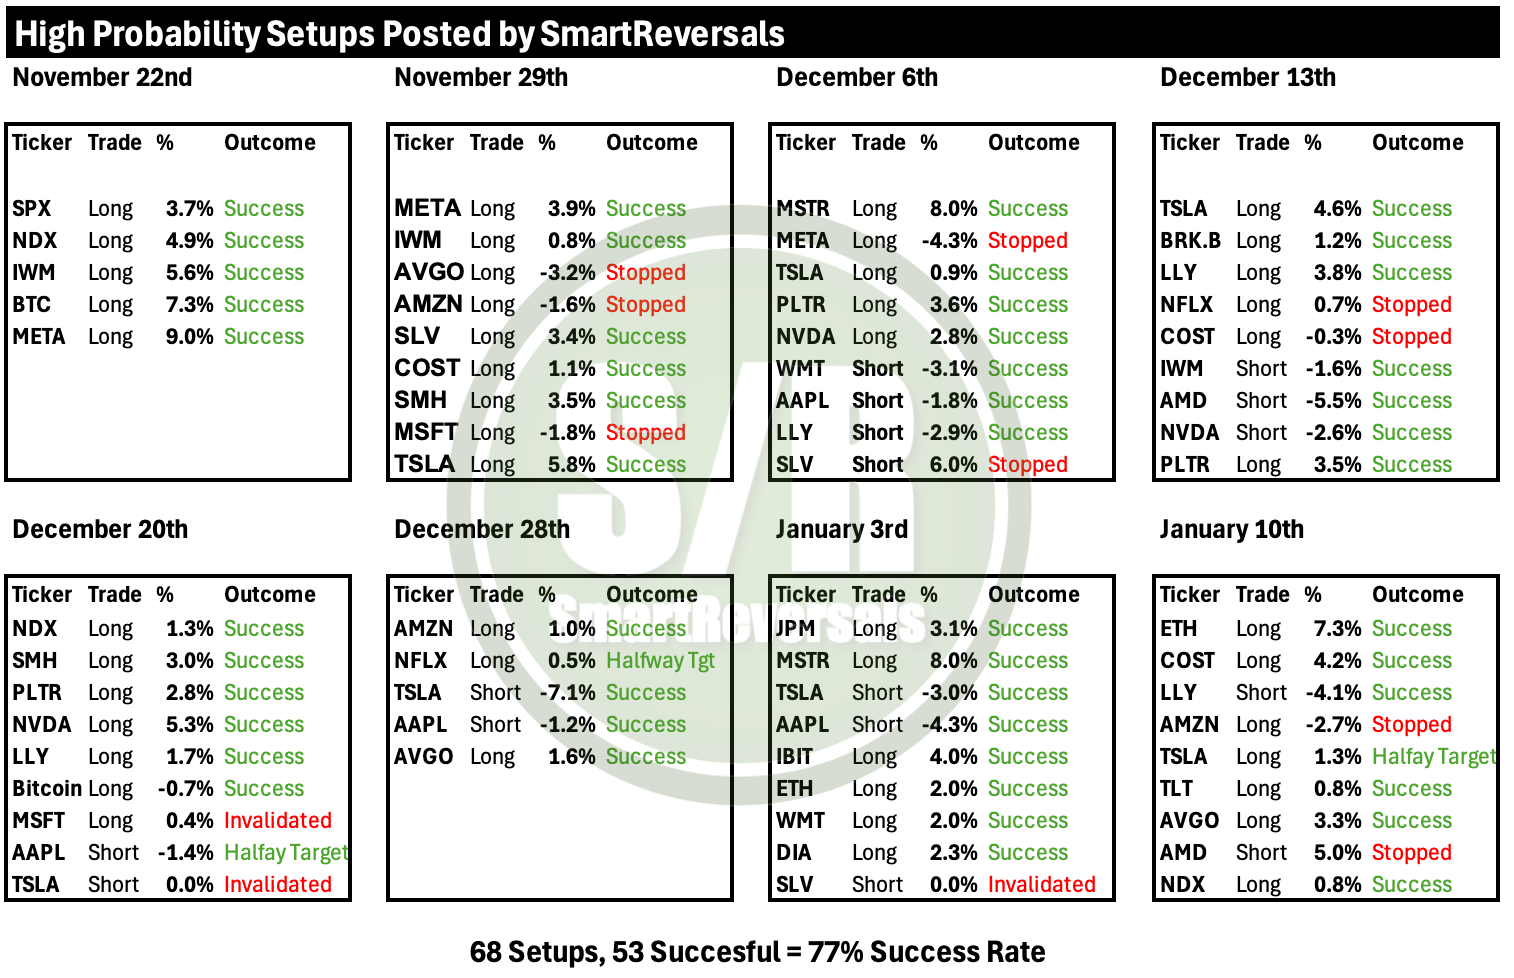
Success in the markets is built on disciplined technical analysis and the precise execution of price targets. This week, 7 of our 9 high-probability setups were successful, providing our subscribers with clear, actionable insights.
A core tenet of our strategy is market neutrality. Upside momentum can be monetized through longs or call options, as well as downward moves via shorts and puts. Leveraged ETFs are also part of the equation for broader indices and specific mega-cap. Being truly neutral also considers rotation, finding opportunity wherever it emerges, whether in Tech, Retail, Finance, Pharma, Metals, Crypto, or Bonds. My only strict requirement is that every asset must maintain high market capitalization to ensure liquidity and reliability.
The Three Pillars of Our Approach
Momentum Analysis: Six months ago, I introduced the Momentum Map to this publication. It has since become a crucial tool, helping subscribers visualize exactly where each security sits within its respective market cycle.
Individual Setups: We perform deep technical analysis on every security for a specific reason: Relative Strength in a map does not rule out overbought conditions. I recently anticipated this for AAPL, TSLA, LLY, and JPM, forecasting pullbacks despite their strength. Conversely, lagging securities extremely oversold can be primed for a bounce, as seen in my recent successful calls for Bitcoin, Ethereum, and COST. The technical chart with the right indicators is essential.
Execution & Risk Management: This week, we perfectly nailed the rallies in Ethereum and COST, alongside the anticipated sell-off in LLY. Other securities moved in the right direction reaching their targets. Every setup, not only for the most probable ones but for all the securities tracked has an invalidation level to be used as a reference to protect capital.
Turning Analysis into Action
Our high-probability setups provide specific price targets. Once a target is hit, it can be transitioned into a new stop-loss reference to protect capital, or the gains can be locked in.
This methodology allowed AVGO, NDX, and TLT to reach their targets with precision this week. We maintain full transparency regarding our performance: our track record over the last several months currently holds a 77% success rate. My focus remains on price-action-based actionable for investors who demand clear, straight-to-the-point insights. This publication works for full time traders, and for people who work in their 9-5 and want to set their trades with clear parameters.
Last Wednesday, I released a guide outlining the essential components of a successful trade with real-world examples of critical decision-making for various scenarios: when a target is reached and immediately reverses, when momentum carries price beyond the target, or when a setup lacks the ‘fuel’ to reach its destination. I also cover risk management for those instances where price action moves against the setup. Get access here:
Upgrade to a paid subscription today and they access to all the content at smartreversals.com The setups for next week are studied right in this publication, one single setup can pay for the whole monthly or annual subscription.
Today’s Agenda
Market Overview
Momentum Map
High Probability Setups
SPX and Major Indices, Volatility Breadth, Bitcoin
Individual Stocks, Metals, ETFs.
Market Overview
Geopolitical and monetary headwinds tempered risk appetite throughout the week. President Trump introduced fresh volatility by threatening tariffs on nations opposing U.S. interests in Greenland, raising concerns about trade stability. Simultaneously, uncertainty surrounding Federal Reserve leadership intensified. National Economic Council Director Kevin Hassett may remain in his current role rather than receiving the nomination for Fed Chair, positioning Kevin Warsh as the leading contender. On the economic front, industrial production rose 0.4% in December and initial jobless claims fell to 198,000. This strength pushed Treasury yields higher, with the 10-year note settling at 4.23% as traders dialed back expectations for near-term rate cuts.
Fourth-quarter earnings season commenced in earnest with mixed results from the banking sector. PNC Financial Services advanced nearly 4% after posting a 25% profit increase, whereas Regions Financial fell short of expectations despite solid revenue growth. Technology shares displayed a sharp divergence. Semiconductor stocks rallied led by a nearly 8% surge in Micron Technology following a massive $7.8 billion insider stock purchase and a new facility announcement. Conversely, software stocks came under pressure, driving the iShares Software ETF IGV to its lowest level since May. In the industrial space, GE Vernova surged over 6% after the administration called for expanded power plant development.
We are seeing significant variations week per week in sector performance, this week the main laggards were financials and communications, which is not surprising from the technical stand point, JPM was not the only financial stock brewing a pullback based on their overheated conditions, on the communications side we will study below the setup for GOOG, which is printing a pullback setup, and for META we will study the loss of a significant annual level.
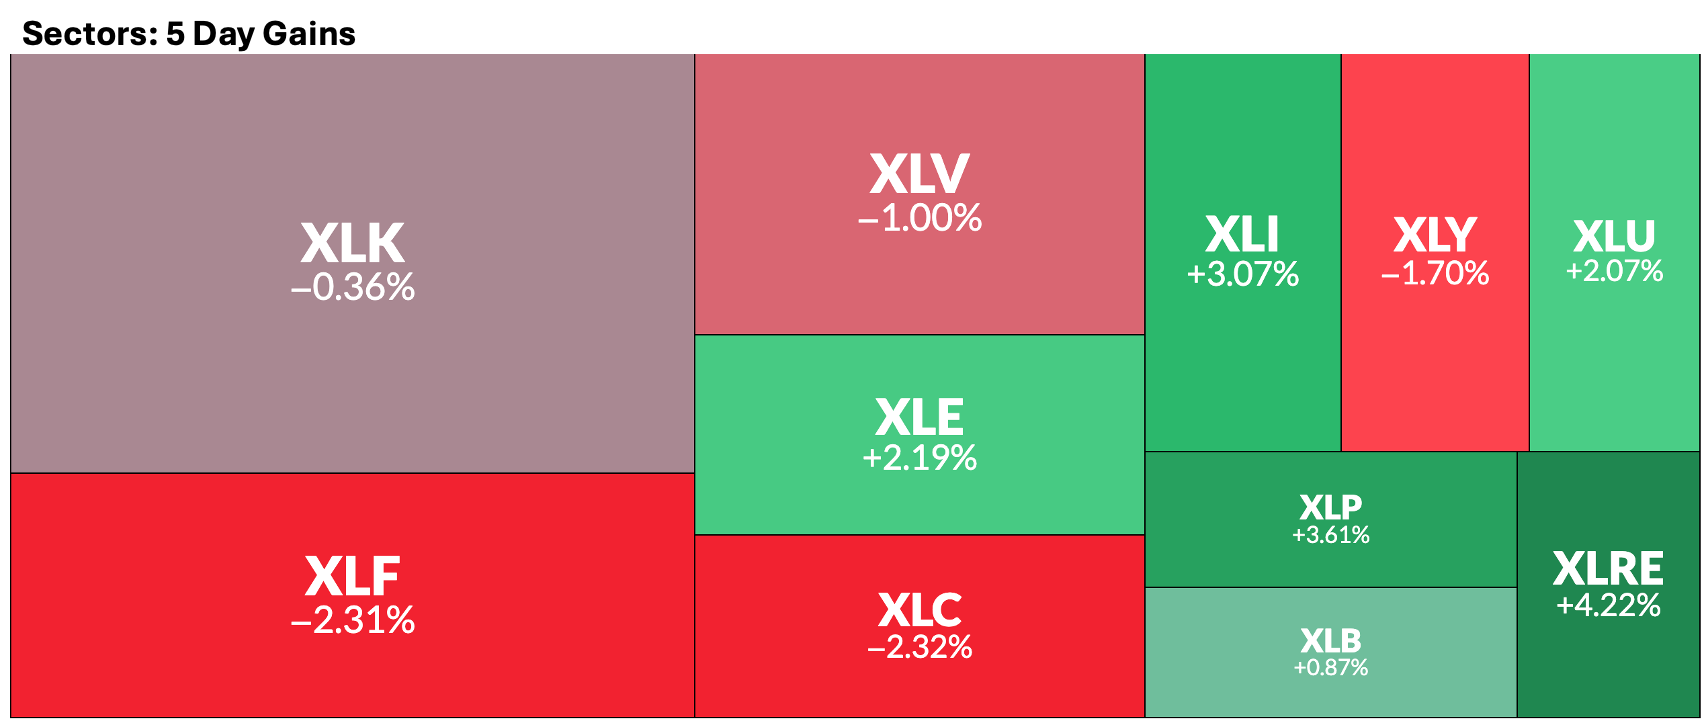
In technical analysis, seeing defensive sectors like Utilities (XLU) and Consumer Staples (XLP) rally while the SPX and NDX are stagnant or declining is often interpreted as a bearish warning sign, signaling a "Risk-Off" rotation. When investors lose confidence in high-growth areas like Tech (NDX) or consumer discretionary (XLY, where TSLA and AMZN are key players), they rotate capital into sectors with stable earnings and high dividends. These companies provide electricity, water, and household goods implying inelastic demand, meaning people buy their products regardless of the economy.
Yesterday I mentioned in the chat (you received the notification by email anyway), that breadth has reached the 70% milestone (stocks above 200DMA). That condition along with the "defensives" moving higher adds references to consider market cracks with tech exhausted.
Momentum Map
Let’s discuss again the mechanics of stock rotation. Regardless of the specific security, price action inevitably fluctuates between overbought extremes that trigger pullbacks and oversold conditions that ignite bounces.
Our core universe consists of high-market-cap, high-liquidity securities with strong fundamentals. This fundamental filter is vital; without it, a stock might stay trapped in the lagging quadrant indefinitely. This is why the individual technical analysis provided in our setups is the essential “key” to timing these rotations.
Several months ago, I highlighted that AAPL and TSLA were due for a recovery. Their charts eventually flashed the precise triggers confirming that a bounce was underway. We saw a similar pattern play out with LLY, and we are witnessing that same validation now with COST.
However, the “Risk-On” phase for some has shifted. We recently observed vanishing rallies, and bearish crossovers that have validated the recent corrective moves in AAPL and TSLA. While LLY is expected to catch up to this corrective phase soon, Bitcoin (BTC) is currently brewing a move that COST has already validated.
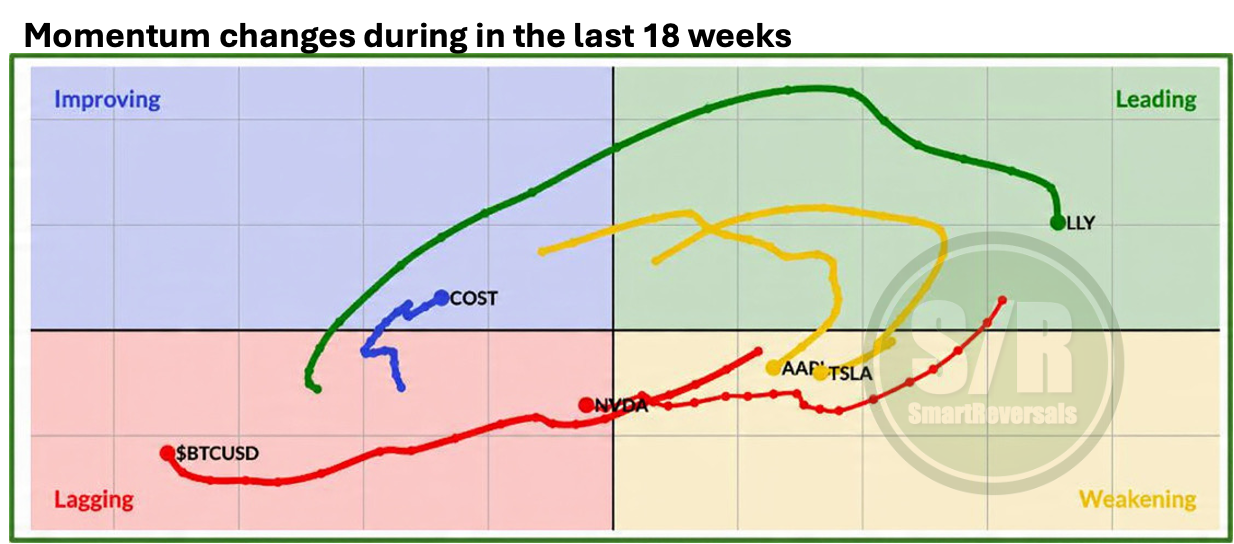
NVDA has rotated into the lagging quadrant, a shift that suggests buying opportunities on the horizon as it nears an oversold extreme; we will study that today.
We permanently track the market’s Megacaps and leaders to give you a broad market perspective. This constant focus allows you to catch the capital rotation before the crowd does and pinpoint the perfect time to enter. We Cover:
Indices: SPX, NDX, DJI, IWM, ES=F, NQ=F
Majors: AAPL, MSFT, GOOG, AMZN, NVDA, META, TSLA, BRK.B, LLY, WMT, AVGO, COST, JPM, PLTR, NFLX
ETFs & Commodities: SPY, QQQ, SMH, TLT, GLD, SLV, DIA, SH, PSQ
Crypto: Bitcoin, ETH, IBIT, MSTR
Leveraged: TQQQ, SQQQ, UDOW, SDOW, UPRO, SPXS, URTY, SRTY
Ensure you have the right tools to navigate the current market. Subscribe now to unlock the Weekly Compass, including 20+ charts and next week’s price targets.
The map below illustrates our complete universe of securities. This provides the necessary context before we dive into today's high-probability setups, which have been enhanced with target extensions and a new key performance metric: