
Critical Levels to Watch: Annual S/R for Stocks & Commodity ETFs
It appears unlikely the Federal Reserve will lower interest rates before September, if at all this year - Market update for indices, stocks and commodity ETFs


Following a disappointing inflation report today, it appears unlikely the Federal Reserve will lower interest rates before September, if at all this year.
The January Consumer Price Index revealed a 0.5% increase from the previous month, bringing the annual inflation rate to 3%. This figure is slightly higher than December's rate and only marginally below the 3.1% recorded in January of last year. The situation is more concerning when excluding food and energy, as the core inflation rate, which the Fed prioritizes, rose to 3.3%; significantly above the Fed's target.
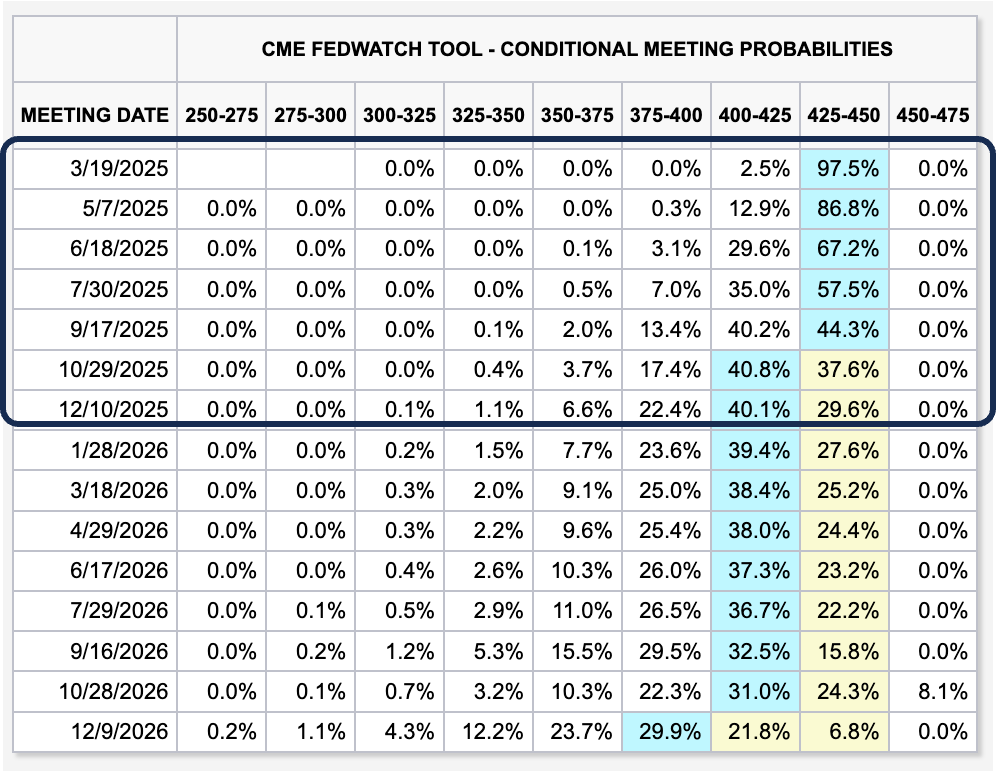
According to CME Group's FedWatch data from late Wednesday morning, the odds of a Fed interest rate cut are slim for the next few months. Traders of Fed funds futures see only a small chance (2.5%) of a rate decrease in March and still relatively low probabilities in May and June. The likelihood increases somewhat in July and September, but even then, a cut is far from certain. Market expectations, as reflected in futures pricing, don't favor a rate cut until October.
FED Chairman Jerome Powell, in testimony before the House Financial Services Committee, reiterated that while substantial progress has been made in curbing inflation from its peak, further action is needed. He emphasized the Fed's intention to maintain a restrictive monetary policy stance for the time being.
Bearish signals are still in play for SPX
Last Monday, the bearish engulfing candle was analyzed in a brief publication for everyone (click here), and today’s price action continues below a resistance diagonal and the high of last Friday’s bearish engulfing candle.
The Bullish percent (BPI), a market breadth indicator useful to assess market sentiment and potential trend changes is also raising warning flags for a pullback.
High BPI (above 70-80%) suggests bullish sentiment. A large percentage of stocks are in uptrends. However, extremely high readings can also be a sign of overbought conditions, potentially indicating a future pullback, hence the yellow horizontal line in the chart. On the other hand, low BPI (below 30-20%) indicates weak bullish sentiment. Most stocks are in downtrends. Very low readings can be a sign of oversold conditions, potentially suggesting a future bounce or rally.
Right now the index is in a neutral zone experiencing a period of transition, it is curling down and in previous occurrences the SPX has moved accordingly as highlighted in the chart.
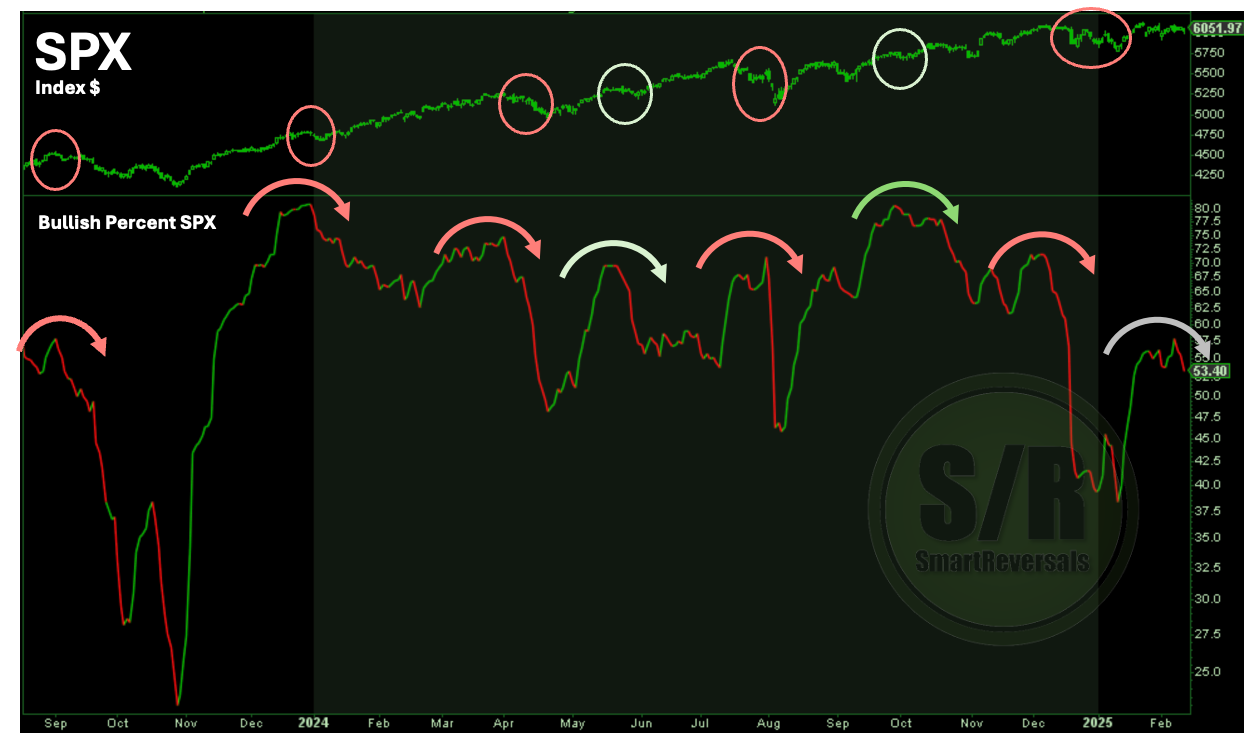
Since the chart presents the last 18 months, the red circles (pullbacks) may look mild, but the first circle in the chart is the beginning of a 10% correction in the SPX during Q3 2023, there are light green circles indicating horizontal consolidations, and the latest one which is yet to confirm what is it anticipating.
As any indicator, it has to be used in conjunction with price action, S/R levels and the indicators that are explaining better the recent moves.
Unlock the complete analysis for SPY, QQQ, NVDA, GLD, and DBC update, and the well anticipated second installment of the annual S/R levels.
When you become premium subscriber, you also get access to exclusive Macro and fundamental analysis, educational content, 20+ chart deep dives every Saturday in the Weekly Compass, and key weekly S/R levels. Each bullet point is a link that gives you immediate access:
Let’s begin:
SPY
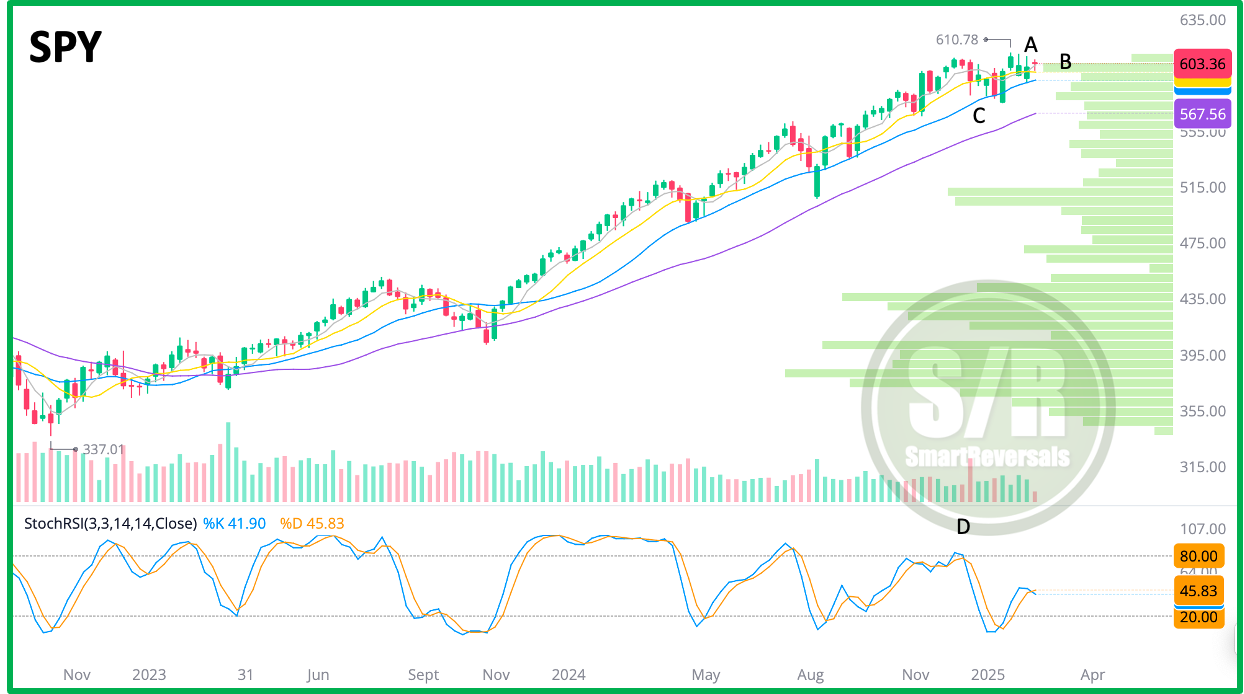
Price action indicates the following: