

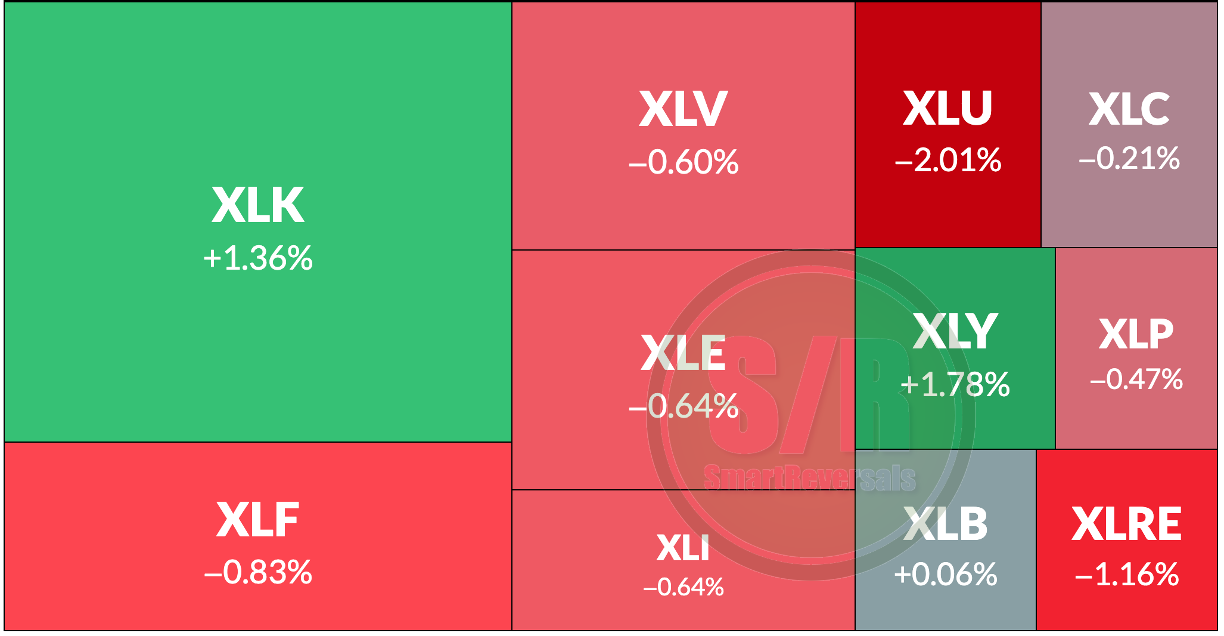
As mentioned in the Weekly Compass last Saturday, when social media was flooded with posts about a potential black Monday, the SPX and technology, mostly driven by semiconductors (SMH), was primed for a bounce given the technical conditions outlined in the publication. Today's move is not surprising, and we will analyze what criteria must be considered to increase the probability of continuation following the bounce.
Now that the bounce has materialized, the prevailing question is: Is the bottom in?
However, we should perhaps rephrase the question: Is the sector rotation over?
That consideration is driven by the divergences we have witnessed over recent days, where semiconductors cratered while non-tech sectors rallied, as seen in COST, WMT, XOM, LLY, JPM, and V while NVDA, MU, and AMD sold off sharply. Today, we saw the inverse: was this simply tech experiencing a technical bounce while non-tech underwent a healthy pullback?
In case you missed the Weekly Compass, the publication is here:

When you subscribe to the paid plan, you get access to my Market Intelligence and educational collection, along with two ebooks on technical analysis covering both fundamentals and advanced indicators.

Today’s Agenda
How to Validate a Bounce?
Watchlist Tracker
Daily plan for SPX and ES=F
Daily Levels Combined with Longer Timeframes for SPX, ES=F, NVDA, AMD, MU, SPCX, META, TSLA.
Why that combination of levels? Semiconductors must prove their bounce, while the other three are posting earnings this week.
Let’s begin.
How to Validate a Bounce?
Last Friday, I posted these two charts highlighting how crucial it is for each ticker to recover its central weekly level (CWL), and even better, for a structural improvement, its central monthly level (CML).
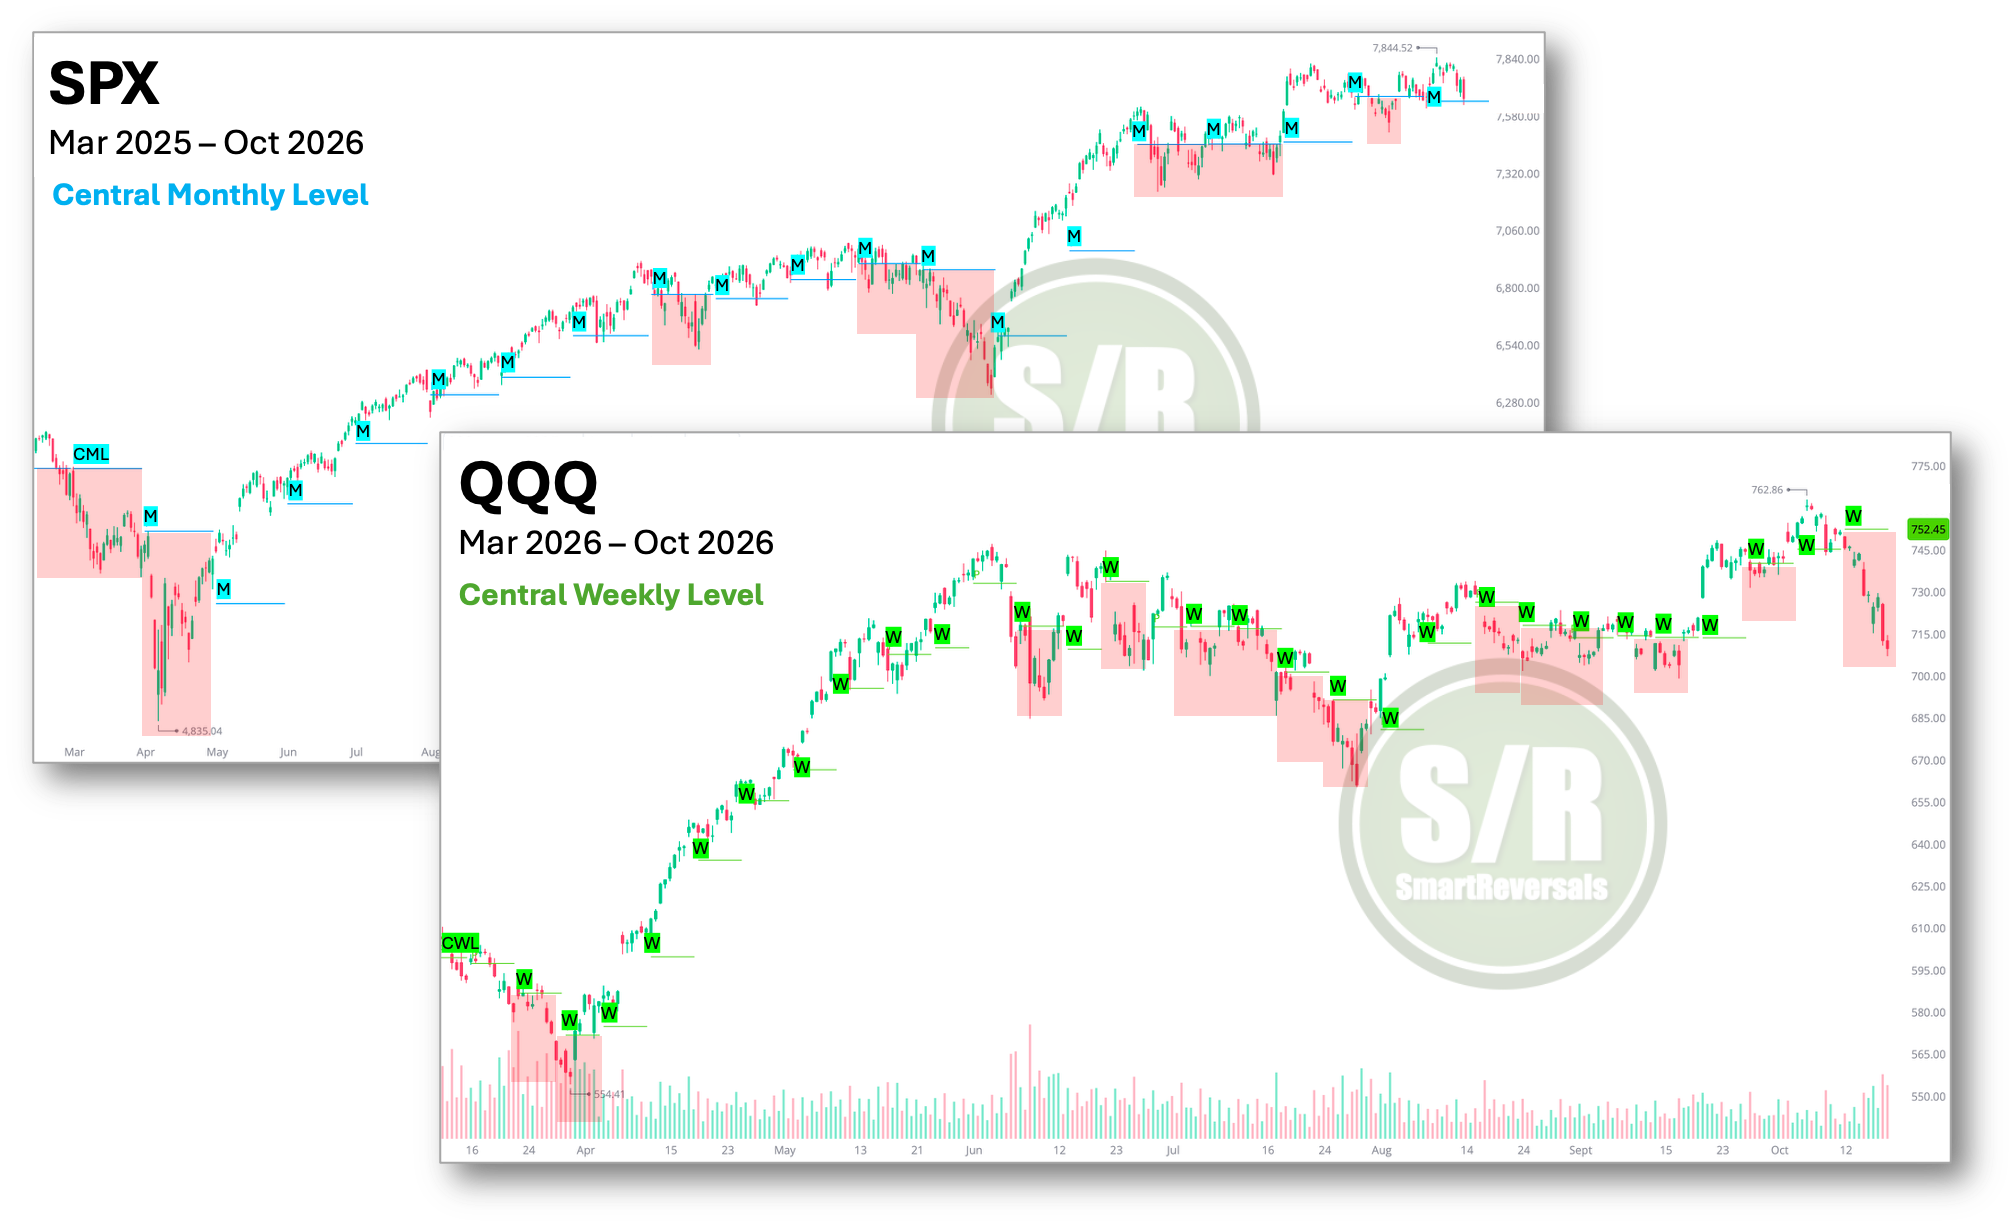
The charts presented the implications of losing those levels, and the red marks made it clear when that happened. So yes, one of the criteria to validate a bounce is the recovery of one of those levels, ideally both, alongside other four elements.
Spoiler alert: Neither the SPX, NDX, nor their ETFs (SPY and QQQ) recovered their weekly levels today. (details below with the charts)
The weekly and monthly levels for the following tickers are below in my Watchlist Tracker, if you trade some of these tickers this publication is for you:
Indices & Futures: SPX, NDX, DJI, IWM, ES=F, NQ=F
ETFs: SPY, QQQ, SMH, TLT, GLD, SLV, DIA, VXX
Major Stocks: AAPL, MSFT, GOOG, AMZN, NVDA, META, TSLA, SPCX, LLY, WMT, AVGO, COST, JPM, XOM, PLTR, NFLX, V, AMD
Crypto & Related: Bitcoin, Ethereum, ETHA, IBIT
Leveraged ETFs: TQQQ, SQQQ, UDOW, SDOW, UPRO, SPXS, URTY, SRTY
Some individual names recovered their levels as follows, and we continue with the four factors to assess today’s bounce:
Factor 1: Recovered Levels
This is the breakdown not only for the SPX and NDX, but for all our watchlist: