
Earnings Face-Off: Will the Rally Take a Breather?
Historical Momentum, Big Tech Magnets, and Five Indicators to Watch

U.S. equities concluded the week on a decidedly bullish note, driven by major geopolitical de-escalation and a strong start to earnings season. The S&P 500 advanced 4.5% for the week, crossing the 7,100 milestone for the first time and closing Friday at a record 7,125.36. This marks an 11.9% gain for the benchmark index over the past three weeks. The tech-heavy Nasdaq Composite rose 6.8% weekly to settle at 24,468.48, notching its 13th consecutive day of gains and extending its longest winning streak since 1992. The blue-chip Dow Jones Industrial Average added 3.2% for the week to close at 49,447.92, while the small-cap Russell 2000 reached a new all-time high after jumping 5.5% during the week.
Last week we studied the relevance of $6,816, with historical charts that presented how important is the recovery of the 20 weekly average, now that it happened it can be mentioned here for everyone, with the SPX +4.5% above that line.
Receding conflict in the Middle East provided the primary lift for sentiment. Equities rallied after Iran declared the Strait of Hormuz completely open following a ceasefire agreement between Israel and Lebanon. The reopening of this trade route triggered a sharp decline in energy markets. Brent crude futures dropped 8.7% to $90.71 a barrel, while U.S. West Texas Intermediate crude futures slid 10.6% to $84.69. Despite the broad shift into riskier assets, gold remained elevated at approximately $4,823, reflecting sustained interest in traditional safe havens. In crypto, Bitcoin and Ethereum have rallied above 6% this week so far.
Technically speaking, the selloff in oil has reached oversold conditions, and yesterday I posted in the S/R levels edition the chart for XOM, that is currently suggesting a potential spike (spike does not mean all time highs).
Corporate earnings and technology developments also drove significant price action. Oracle gained nearly 30% for the week, boosted by new artificial intelligence agreements, while Goldman Sachs rose 3.13% on Friday following solid first-quarter results. On the negative side, Netflix dropped between 9.7% after issuing a disappointing revenue forecast for the second quarter. The quantum computing sector saw massive volatility, with stocks like D-Wave Quantum and IonQ soaring over 50% after Nvidia launched a new open-source quantum AI model.
Despite of the rally, NFLX proves that every company must prove their ratios otherwise Wall Street will punish a disappointing earnings result. From our Blueprint of trades posted last Saturday, we saw good performance this week, with NVDA, AAPL, QQQ, JPM, IBIT, ETHA, META, and even NFLX surpassing their bullish targets. PLTR, TSLA, and V reversed as expected also printing rallies, while LLY was the only security that went in the unexpected direction but our Central Weekly Level (CWL) used as a reference for stop losses protects capital.
Every setup posted in this weekend’s publication includes price targets, invalidation levels, and a risk-reward ratio. This allows you to make informed decisions based on technical indicators and modeled levels where algorithms typically react, as paid subscribers have experienced for over two years. Unlock the analysis for this week by upgrading your subscription.
The week’s price action underscores a market recalibrating around two powerful forces: geopolitical relief and AI-driven momentum. With the S&P 500 now at record highs and the Nasdaq on a historic run, the burden of proof shifts to earnings season to validate these elevated levels. Investors should watch whether the energy pullback translates into improved consumer sentiment and whether tech leadership can broaden beyond the usual names. For now, the bulls are firmly in control, but complacency at all-time highs rarely pays.
Securities Analyzed Every Week:
Indices & Futures: SPX, NDX, DJI, IWM, ES=F, NQ=F
ETFs: SPY, QQQ, SMH, TLT, GLD, SLV, DIA, VXX
Major Stocks: AAPL, MSFT, GOOG, AMZN, NVDA, META, TSLA, BRK.B, LLY, WMT, AVGO, COST, JPM, XOM, PLTR, NFLX, V, AMD
Crypto & Related: Bitcoin, Ethereum, ETHA, IBIT
Leveraged ETFs: TQQQ, SQQQ, UDOW, SDOW, UPRO, SPXS, URTY, SRTY
Having a constant set of securities allows you to anticipate rotations and to time better individual names. If you trade some of the securities listed, this publication is for you.
Today’s Agenda
The Momentum Map: Analyzing the stage of every security in a single chart.
Setups Blueprint: Entry levels for short and long setups with price targets and invalidation levels for all the securities in the watchlist prioritizing stronger setups.
Market Context: Technical charts and price levels for the SPX, U.S. Indices, Volatility, Breadth, and Bitcoin.
Deep Dive: Individual analysis of Metals and Mega Caps (20+ charts).
Let’s begin.
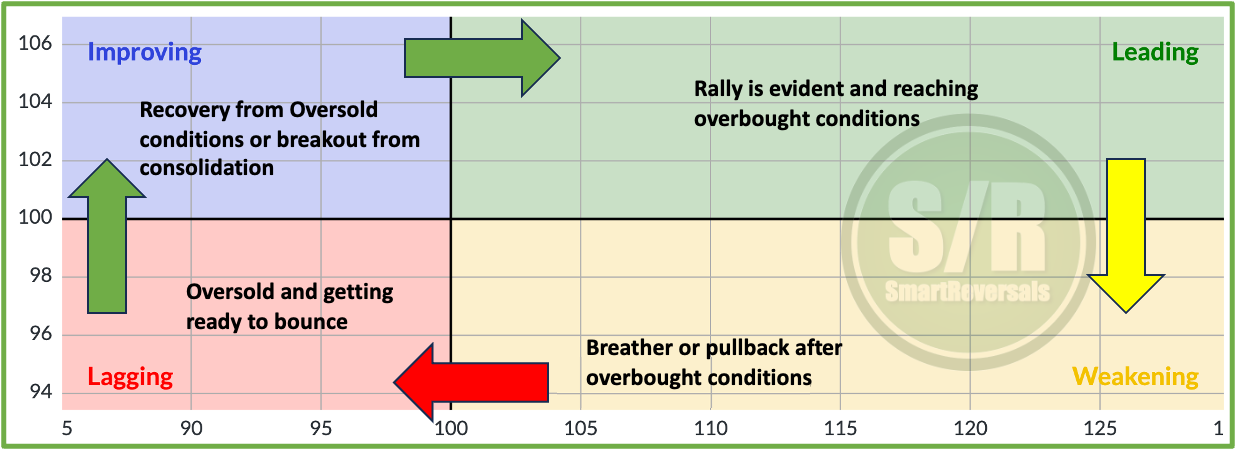
Momentum Map
To our new subscribers: welcome. It is always helpful to recall the cyclical nature of the market. Stocks bounce from oversold conditions (improving), rally into strength (leading), hit overbought extremes, and eventually pullback (weakening) to become laggards. I integrated this rotation feature into the Weekly Compass a year ago, and it has been remarkably consistent.
We saw this cycle play out with the euphoria in NFLX after the 2025 crash, followed by PLTR, MSFT, and Bitcoin, all of which declined sharply in Q4 2025. Meanwhile, names like GOOG, LLY, SLV, and GLD looked unstoppable in rally mode until they fell sharply. As we stand today, the cycle will inevitably continue its course.
All the securities mentioned are analyzed in our Momentum Map, allowing you to identify opportunities and threats in a single glance. Combined with the individual charts included here, you can easily assess whether a reversal is imminent or if the current momentum still has room to run.
Using this tool the bullish reversal thesis for stocks like META, COST, BITCOIN, and even NFLX were anticipated recently. Just last weekend this approach was key to consider the bounces for PLTR, V, and TSLA.
The updated momentum map, followed by the SPX analysis, the setups blueprint for next week, and the individual charts continue here: