Essential Levels in Case of a Healthy Pullback
S / R Levels for May 19th - 23rd - 35 Securities and Educational Content
The strategic use of support and resistance levels is paramount in trading and investing, serving as crucial confirmation for various setups. The past week perfectly illustrated this, with the market experiencing the squeeze I anticipated in last week's publication, a move that gained significant momentum due to the bullish outlook indicated by the VIX and the fact that the price stayed way above $5,659, which was the level that had to stay as support to maintain the price structure with bullish momentum. Click the image below to access the publication:
Regarding specific levels, the set posted last Friday for 35 securities proved its value; notably, the $5,868 mark on the SPX, initially the third weekly resistance, flipped to act as support, demonstrating its significance by triggering bounces on both May 14th and May 15th. This real-time example underscores how diligently monitoring and understanding these key price thresholds can provide traders with actionable insights and enhance the accuracy of their trading decisions.
How to validate reversals using the levels?
When price action approaches any support or resistance level, it's crucial to analyze it in conjunction with oscillators and Bollinger Bands. These indicators help determine if the price is overbought or oversold, and the likelihood of a reversal increases when such conditions are present.
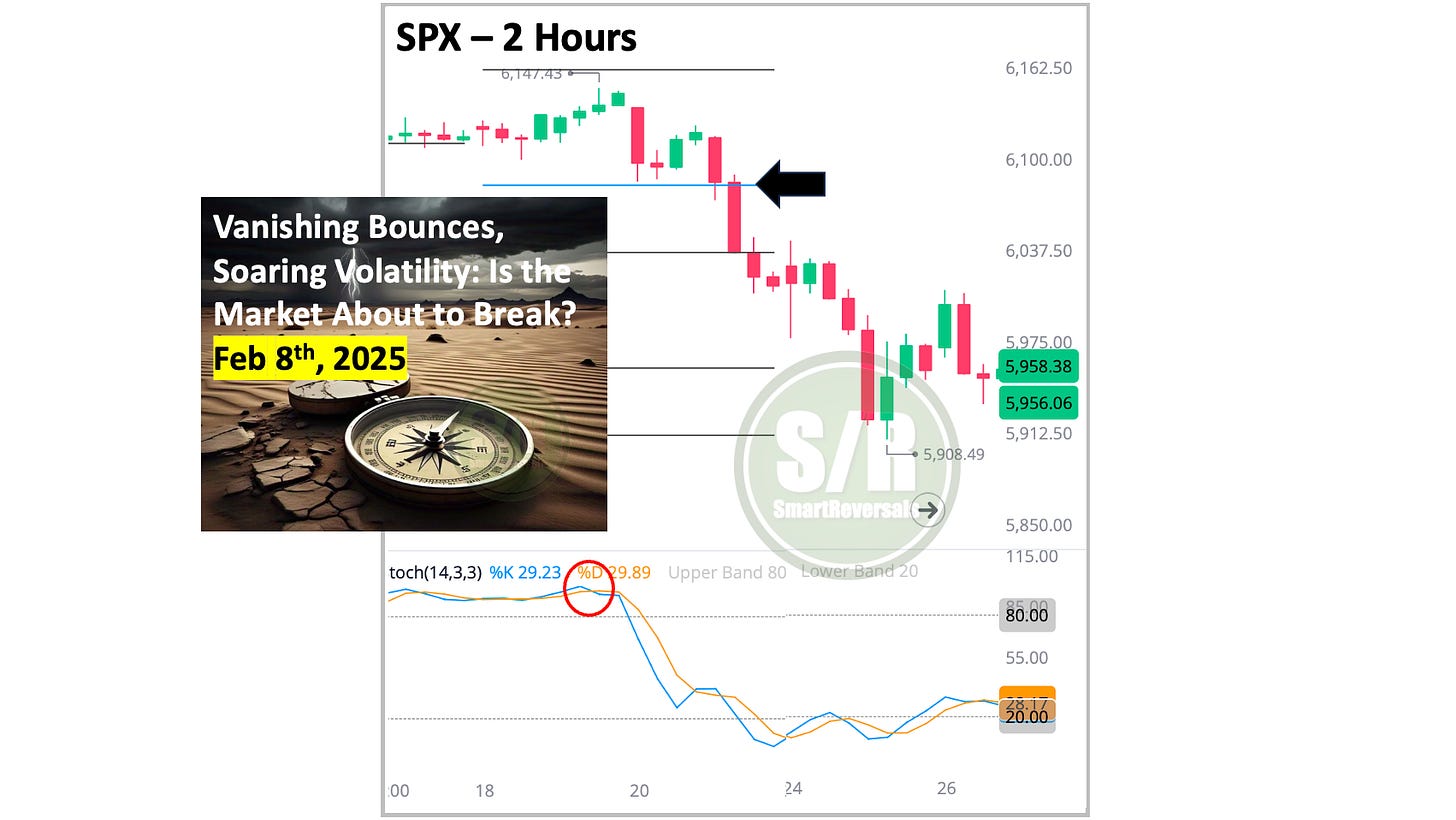
Bearish Reversals: By February 8th, I was anticipating bearish conditions, while the stock market, was in euphoria mode. At that time, the market was overbought on both daily and weekly timeframes, and the use of the central weekly level proved crucial in saving investors and traders who utilize it from significant losses (a -19% correction in the SPX is certainly enough to capture investors' attention). I had already anticipated $4800 as a bear target for disciplined premium subscribers who focus on technical analysis rather than the euphoria or panic fueled by social or mainstream media. The central level back then was $6,081 (black arrow below), and the Stochastic oscillator was overbought in synchronization with longer timeframes (red circle), so when that level was breached, a major bearish signal emerged.
Bullish Reversals: My support and resistances approach models the lines in advance for the following week, and the bearish target for the week of April 7th was $403 for the QQQ (published on Friday, April 4th), that level was reached by Monday, breaching the Bollinger low with oversold oscillators. Leaving apart emotions, the level acted as the low of a -25% bear market correction in the Nasdaq100. By April 9th I started publishing studies about bounces in bear markets, and the possibility of a sustained bounce considering that the central weekly level had been recovered.
When I highlight indicators to monitor, they are most often support and resistance levels, which have proven to be key lines for confirming reversals or, if broken, validating the continuation of those reversals. The blue line in both charts is the central level, and it acted as support on the week of April 9th. I use 2 hours and 4 hours candles to avoid taking decisions on false breakouts. You can see the price breached momentarily the blue line on April 10th, but it managed to close the candle above it.
Since there are signs of exhaustion in the market (Click here to read the previous publication), the central level will be key next week. Unlock that level for 35 securities including SPX, NDX, SPY, QQQ, IWM, DIA, TSLA, GLD, NVDA, PLTR, MSFT, META, NFLX, MSTR, AAPL, GOOG, AAPL, AMD, SLV, TQQQ, UDOW, COST, ES=F, NQ=F, and many more by upgrading your subscription. You don’t need to trade all of the securities posted, you just need to trade one or a couple of the securities mentioned to use this golden information.
The levels posted today are used for the technical charts that are coming tomorrow for 20+ securities, and they will also be used for the market update this Wednesday.
This is a golden tool, that has been combined with monthly levels also shared in this publication. Premium subscribers found this as a good upgrade to the publication as follows:
Thank you very much for your positive feedback, and as mentioned in recent publications, more improvements are coming. Secure the current subscription price.
WEEKLY LEVELS
Securities highlighted in light red are set to start next week in bearish mode, or under the central weekly level. TLT, GLD and MSTR are some of the cases, two Mags7 have the same context:


