
From VIX Spike to Risk-On Rally: Wall Street’s Volatile Week Explained
Support and Resistance Levels for Oct 20th - 24th, Stocks, Indices, Futures, Crypto, and ETFs

This past week on Wall Street exemplified the classic tug-of-war between fear and optimism. After several days of pronounced volatility, major indices finished the week with gains, however, the bearish engulfing candle analyzed last week has not been invalidated, and the price continues tamed by the 20 daily moving average.
In the previous Weekly Compass I anticipated the likelihood of a bounce considering the McClellan Oscillator, which happened on Monday, but the week was choppy and the close on Friday was essentially the same from Monday. Fundamentally speaking, the recovery on Friday was primarily driven by a significant sentiment shift surrounding two critical pressure points: the stability of U.S. regional banks and the trajectory of U.S.-China trade relations. Technically speaking, which is my favorite, the Volatility Index opened the day above the upper Bollinger band, and the index just had to come back to earth, but staying above 20.
Regional Banking Sector: From Crisis Fears to Cautious Relief
The financial sector warranted close monitoring throughout the week, beginning under intense pressure. Concerns over credit quality, sparked by disclosures of problematic loans at institutions including Zions Bancorporation and Western Alliance, sent the KBW Nasdaq Regional Banking Index plunging over 6% on Thursday. However, Friday brought a decisive rebound as upbeat earnings from other regional banks, notably Truist Financial, helped calm fears of systemic contagion. This recovery illustrated the market’s hair-trigger sensitivity to banking sector health, a susceptibility that remains elevated given the interest rate environment and commercial real estate exposure many regional institutions carry.
Trade War De-escalation Provides Relief
The banking sector recovery was amplified by a notable softening in trade rhetoric from President Trump, who indicated that negotiations with China were progressing constructively. Crucially, he suggested that his previously threatened 100% tariffs would not represent a “sustainable” policy approach; a reversal from the aggressive posture that triggered last week’s sharp sell off. This turn provided immediate relief to markets, particularly benefiting technology and semiconductor stocks with significant China exposure.
Data Vacuum Shifts Focus to Earnings
This market optimism emerges against the backdrop of persistent challenges, most notably the ongoing U.S. government shutdown, which continues delaying crucial economic data releases. Without official employment reports, GDP updates, and other key economic indicators, market participants are increasingly reliant on corporate earnings reports to gauge underlying economic health. This data vacuum amplifies the importance of the current earnings season, as individual company results provide some of the only real-time insights into consumer spending, business investment, and forward-looking guidance.
Looking Ahead: Fragile Optimism
While this week’s recovery demonstrates markets’ remarkable resilience and ability to absorb negative news, several risk factors warrant continued vigilance. The regional banking sector’s stability remains untested if credit concerns resurface. Trade policy remains fluid and vulnerable to rapid reversals given the administration’s unpredictable approach. Most significantly, the absence of government economic data creates an information gap that could lead to market mis-pricing or delayed recognition of deteriorating fundamentals.
Risk Appetite Back?
The week ahead will be critical in determining whether this optimistic turn represents a durable shift or merely a temporary technical bounce in an ongoing volatile environment. For now, and we will study on Sunday, the weekly inside candle is not an invalidation of last week’s move.
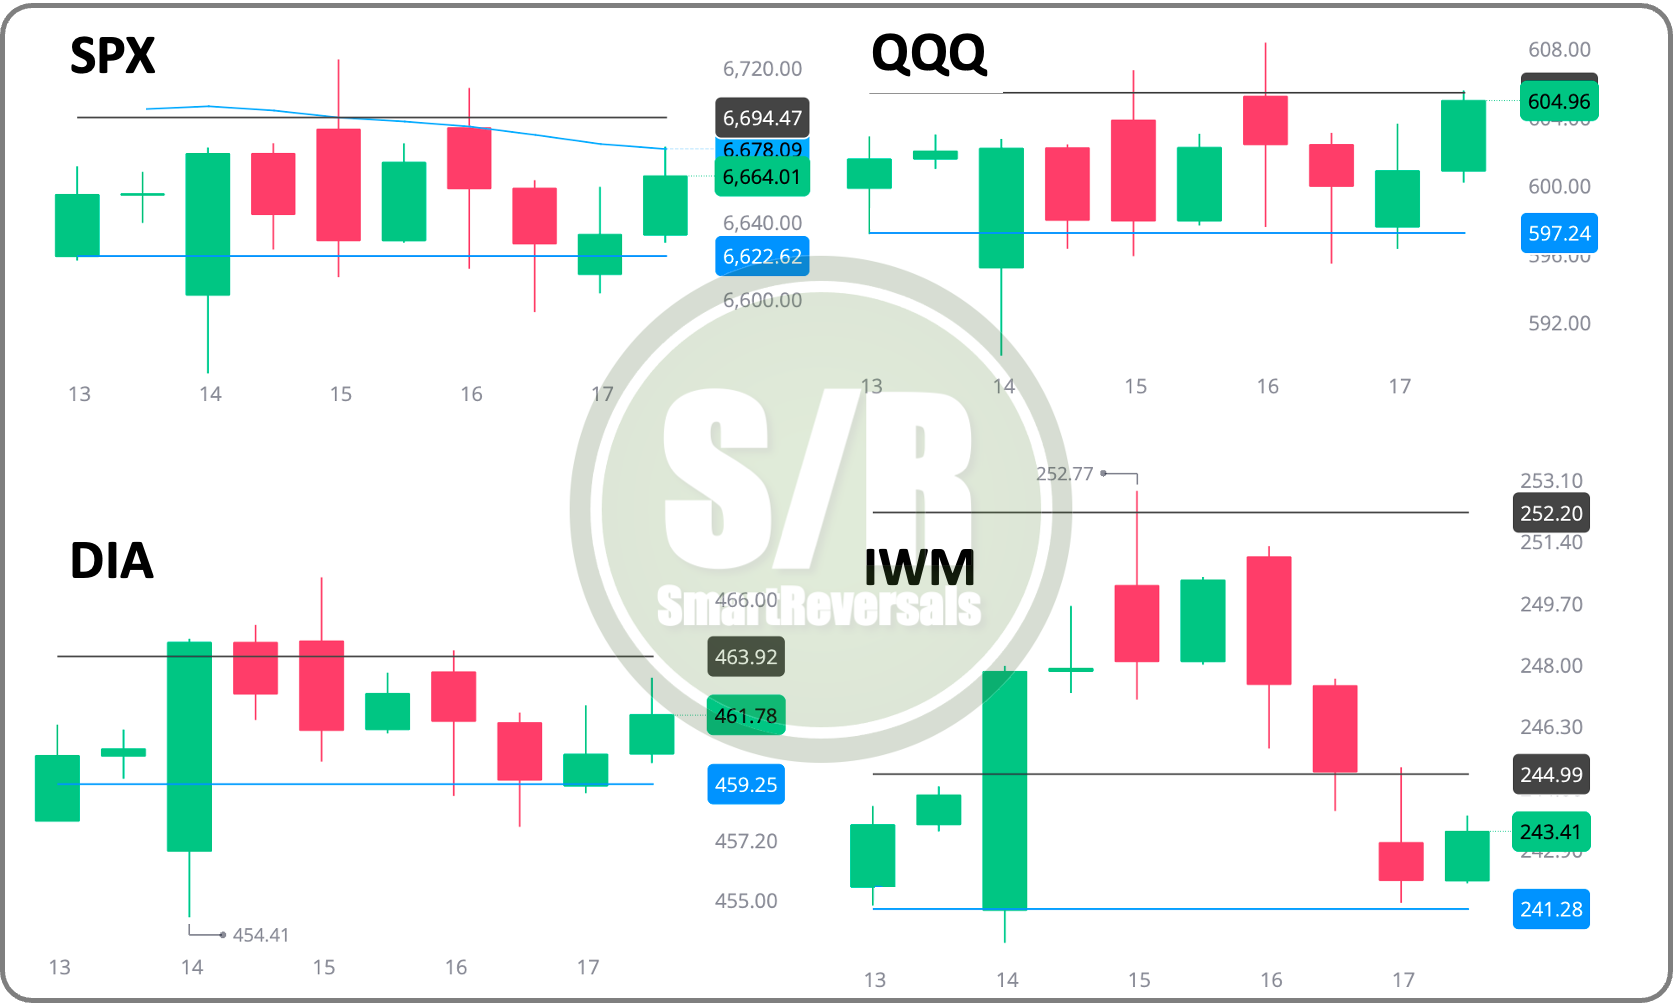
Support and Resistance levels wise, the S&P500 moved in a narrow range during the week: the central weekly level of $6,622 published last week acted as support with temporary breaches, mostly on Tuesday morning, bouncing later, but finding resistance at the bullish weekly target of $6,694.
Similar moves were printed for QQQ and DIA, building an inside weekly candle that anticipate a big move next week. In the case of IWM the rally reached $252, a significant level posted last week, but the price retraced, printing in this case not a weekly inside candle, but a weekly shooting star. Premium subscribers know the implications of those formations when volatility is high.
Let’s continue with the Support and Resistance Levels for next week, an investor can be reading the news all day, or can be focused on these levels that have been proved to be a golden tool to validate reversals or momentum.
The charts above are for just four securities, but this publication consistently analyzes the following ones to provide a broad market perspective and empower your trading decisions:
Indices & Futures: SPX, NDX, DJI, IWM, ES=F, NQ=F
ETFs: SPY, QQQ, SMH, TLT, GLD, SLV, DIA, SH, PSQ
Major Stocks: AAPL, MSFT, GOOG, AMZN, NVDA, META, TSLA, BRK.B, LLY, WMT, AVGO, COST, JPM, PLTR, NFLX
Crypto & Related: Bitcoin, ETH, IBIT, MSTR
Leveraged ETFs: TQQQ, SQQQ, UDOW, SDOW, UPRO, SPXS, URTY, SRTY
Subscribe now, and unlock the levels for next week, the Weekly Compass with 20+ charts and price targets, and the Market Intelligence library (click here) where you can find the access for the free eBook with four sections (Candlesticks, MACD, RSI, Stochastic, Bollinger Bands, and Fibonacci); tap the like button to gather 50 likes for the Moving Averages section to be released this Sunday.
Market Intelligence and eBook with 4 sections ← Link
A new, comprehensive study was added to the Market Intelligence library last Wednesday. This publication is particularly valuable as it approaches the Nasdaq, making it unique since most analyses center on the S&P 500—yet technology is undeniably the driver of this bull market. The technical patterns analyzed within are measured with clear numbers and indicators (and I have to say; good looking charts), leaving no room for subjective interpretation. If you are interested in an objective roadmap of the very likely market moves ahead, this publication is a must-read, click below for access:
Nasdaq’s +50% Surge: What Technicals Say Happens Next ← Link

To unlock this special, data-driven study with the paid plan, the weekly compass, all the premium libraries, and the Support and Resistance Levels for next week, click here.
Premium subscribers can suggest the stocks to model using the S/R levels, remember to let me know commenting today, or in the new weekly thread that I will publish tomorrow.

WEEKLY LEVELS