
Gap Filled: Assessing Resistance or Upside
Support and Resistance levels for next week - Futures, Indices, ETFs, Megacaps, Crypto

The market continues to produce rapid moves that can trap both bulls and bears. This week, for the first time in over a month, the trap favored the bulls; after five consecutive weeks in the red, the main indices (SPX, DJI, and RUT) finally closed with over 3% gains each, the NDX jumped during the week 3.95%.
Modeled Support and Resistance Levels Framed Price Action
The pathway to a green close was not smooth. On Monday, the SPX extended its oversold conditions, moving toward the bearish weekly target of $6,216. Once the overextension concluded, also breaching the lower daily Bollinger Band, the price began the “imminent bounce” anticipated this weekend in the Weekly Compass, where I mentioned the following:
For the week ahead, there is a high likelihood of a relief rally. We will remain focused on the major indices, as the SPY, QQQ, IWM, and DIA are showing potential for a trend reversal. If they recover their Central Weekly Levels, we can begin considering individual setups.
During this turbulent environment, I am posting daily levels so the community can identify early signals of a bullish reversal. This allows us to act without waiting for a 2% move to recover the central weekly level, especially considering the distance from Monday’s close to our $6,458 key level.
That said, paid subscribers knew that reclaiming $6,362 on Tuesday would validate a bullish reversal. The subsequent layers of levels provided further validation and references for trailing stops as the price moved toward $6,458, our “bullish above / bearish below” level for the week. As observed this week, daily levels function well as intermediate targets.
Last night, I anticipated that the reversal candle set the stage for a potential gap fill, not only due to the price action’s structure but also because of the intraday reversal that placed today’s Central Daily Level at $6,579. Since this was above Wednesday’s close, that condition applied pressure to the price.
Trying to anticipate Trump’s specific comments would have been imprudent. While the market expected rhetoric favoring a rally (perhaps a retreat from Iran) that was not the case. Consequently, the market sold off 1.5% overnight, opening below yesterday’s gap. However, dip buyers jumped in above the CWL and at the stretched daily level of $6,494 shared yesterday with subscribers. The gap has now been filled for good, clearing the pathway for bulls who may have been concerned about that magnet.
There is one critical element to consider: the Central Monthly Level. I have shared this since Tuesday so paid subscribers could identify the key level that must be reclaimed to establish better conditions for longs. That level is still acting as resistance, and the current market structure suggests we are not yet out of the woods.
The current price structure can be compared not only with 2025 but with 2022 and many more bear markets, including 2018, 2008, and others. Two examples for the SPX:
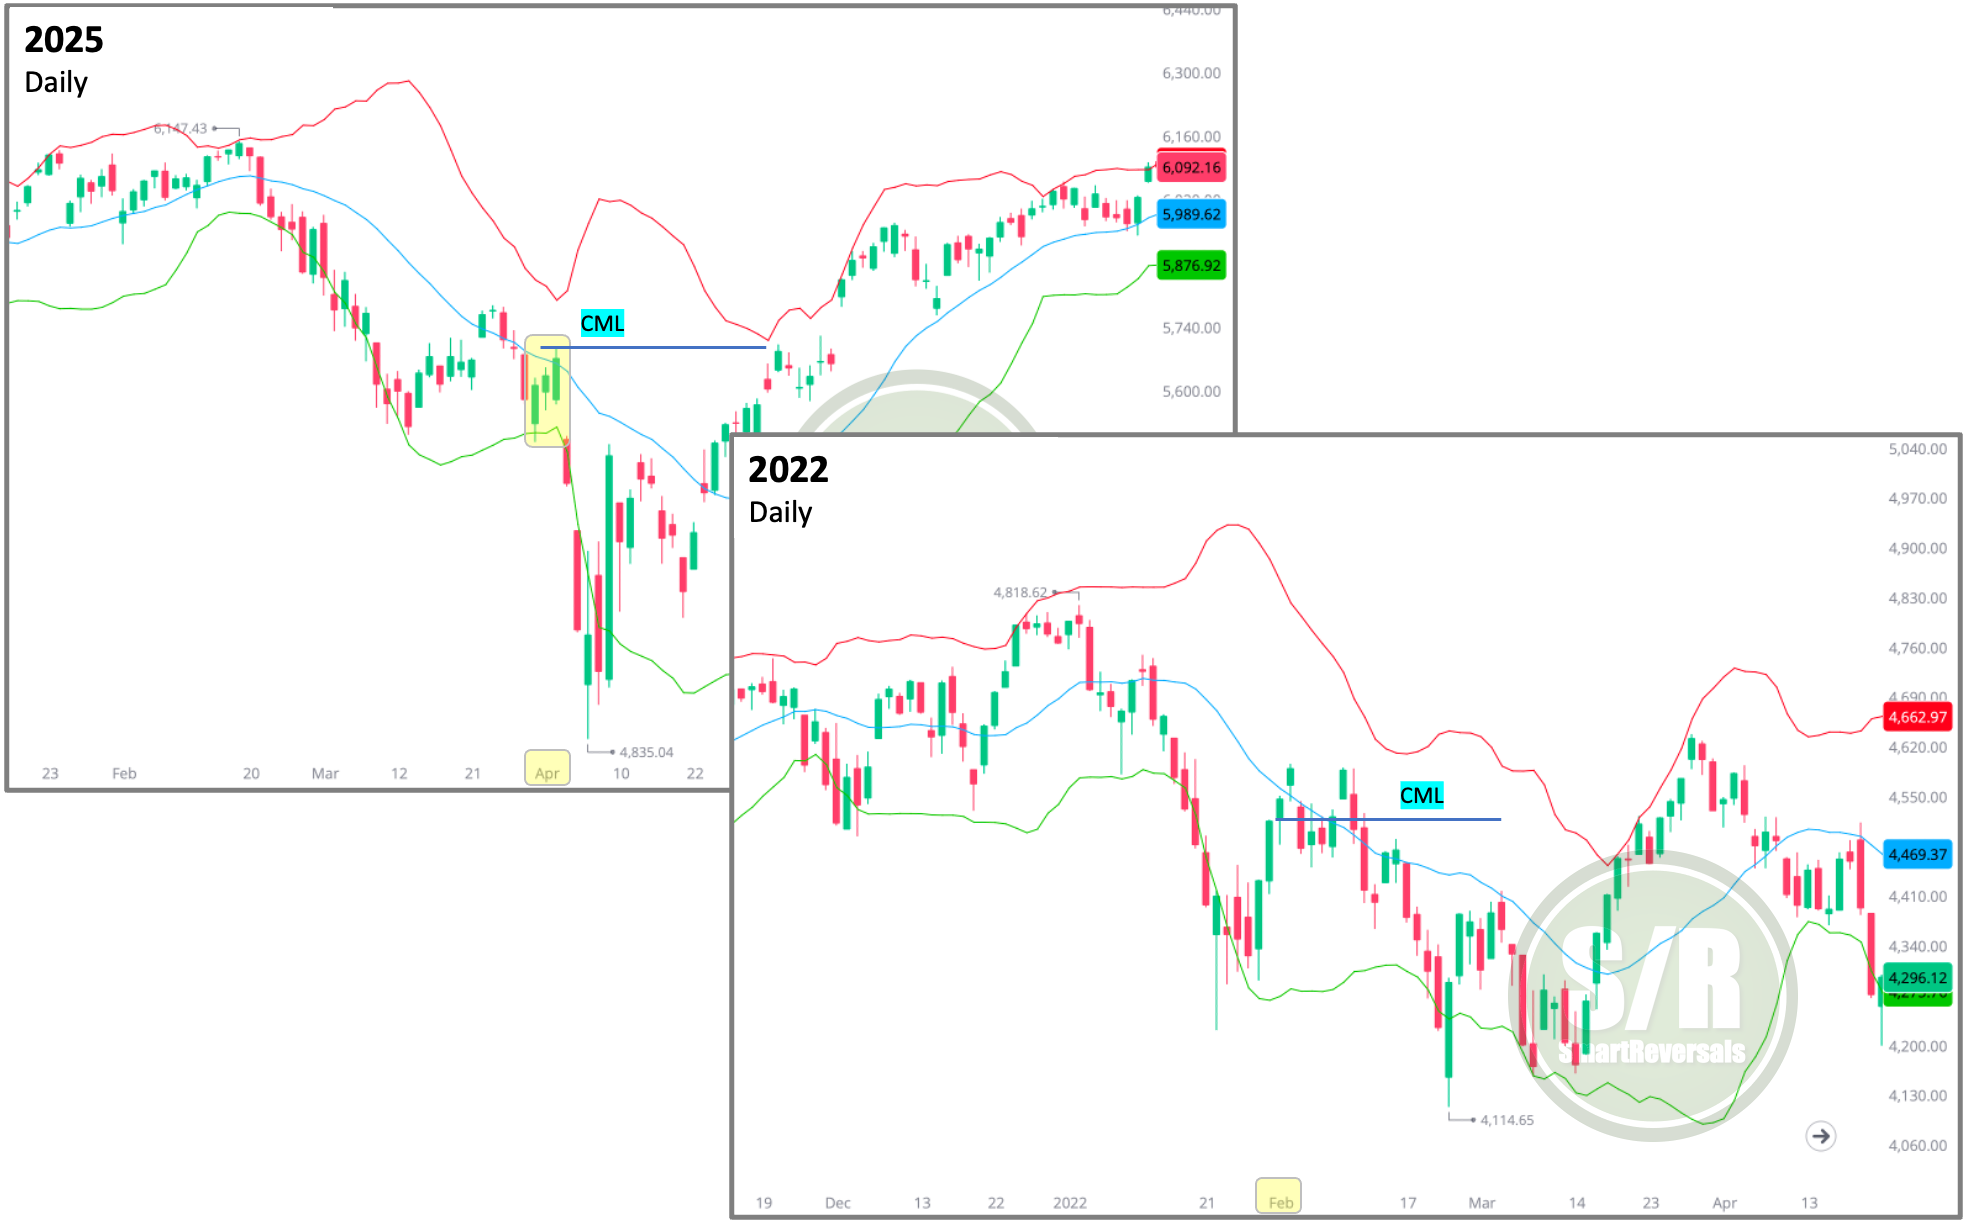
The current structure is perfectly comparable with those years considering the sharp selloff and key monthly levels breached in March, the CML zone is definitive to consider bullish continuation or not in April. From our watchlist, many securities made it above that essential level, let’s study the combined Weekly and Monthly levels with their relative distance to the current prices.
This publication consistently analyzes the following securities to provide a broad market perspective and empower your trading decisions. Maintaining a consistent watchlist is key to improving performance; it allows you to refine the timing of your entries and rotate capital as new opportunities emerge.
Indices & Futures: SPX, NDX, DJI, IWM, ES=F, NQ=F
ETFs: SPY, QQQ, SMH, TLT, GLD, SLV, DIA, VXX
Major Stocks: AAPL, MSFT, GOOG, AMZN, NVDA, META, TSLA, BRK.B, LLY, WMT, AVGO, COST, JPM, XOM, PLTR, NFLX, V, AMD
Crypto & Related: Bitcoin, Ethereum, ETHA, IBIT
Leveraged ETFs: TQQQ, SQQQ, UDOW, SDOW, UPRO, SPXS, URTY, SRTY
Make sure you read my latest Market Intelligence publication, where you can see one single pattern that matches with the bear market bottoms during the last 40 years, including the crashes in 1987 and 2020. If we are in a bear market this measures the potential move remaining. I provide my point of view with also a clear and objective analysis. This is a must read for investors and traders.
Unlock all the content and the essential levels for next week, they frame price action in every market environment.
Let’s begin with the levels.
WEEKLY LEVELS