
Giants Stumble, But Can the Market Keep Dancing?
Technicals can be overextended until they don't. The market's resilience in the face of tech weakness is encouraging. It's worth watching closely to see if this broader momentum can continue.


Is this finally the peak? Which indicators confirm it?
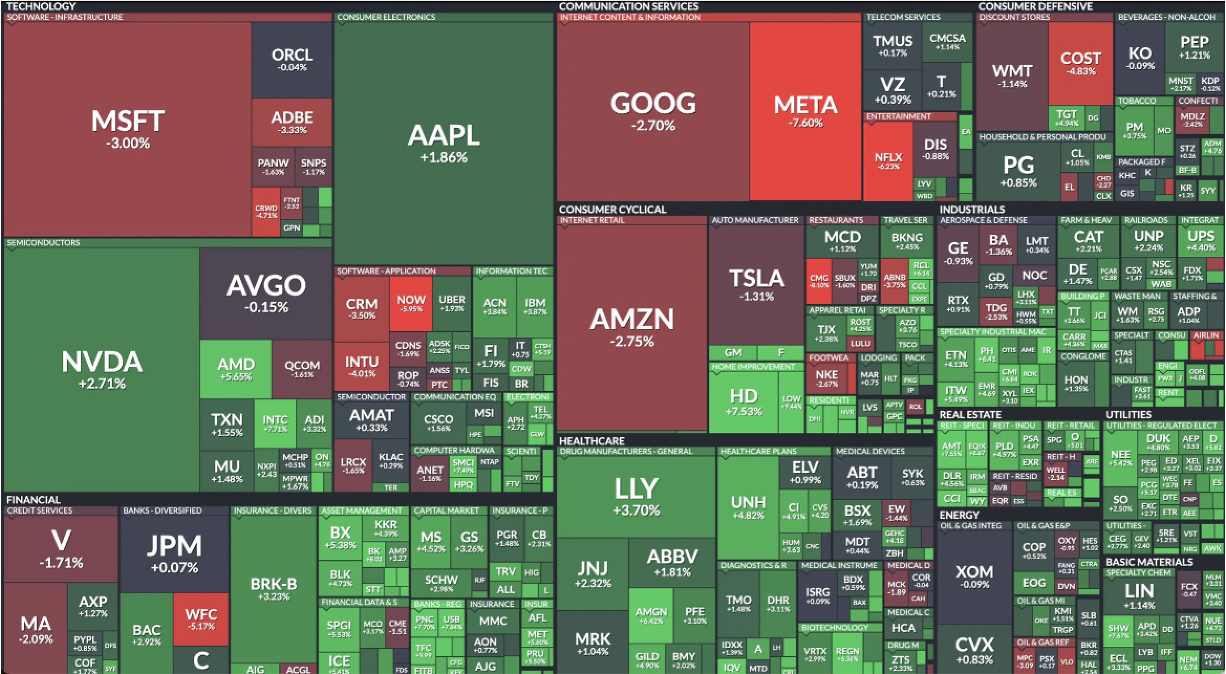
As mentioned in previous editions, when a few key players dominate the indexes, the entire market can catch a cold if they sneeze. This week, Microsoft, Google, Amazon, and Meta all stumbled, causing the Nasdaq (NDX) to end the week relatively flat. Nvidia, Apple, Lilly, and Berkshire Hathaway stepped up to soften the blow.
The week in a glimpse:
July is proving to be a bullish month and it looks like the market is keeping momentum for a little longer, precisely for the low season of the year that is around the corner.
From the previous Weekly Compass:
Bitcoin bounced as expected, also GDX, and DJI as part of a setup described for that index. Also as expected TNX and DXY fell, which gave a boost not just to the S&P 500, but also to the Dow Jones and Russell 2000. However, the Nasdaq felt the weight of its exhausted tech giants.
Big mega caps like GOOG, MSGT and AMZN moved this week accordingly to their overheated technicals seen in the previous weekly compass; actually META proved the relevance of the Bollinger Bands despite bullish weekly price action.
Stay ahead of the curve – subscribe now to get in-depth analysis and insights delivered straight to your inbox!
The context has changed significantly versus the last edition, here are the facts:
SPX
For the second consecutive week, the price crossed above the upper Bollinger Band, but this time it retraced, and the body of the candle closed within the Bollinger range. The RSI continues to show a bearish divergence, with lower highs while the price sets higher highs.
$5611 - $5566 is the key zone to watch next week. If the price closes a daily or 4-hour candle below this zone, a pullback to at least the $5520 zone is likely, with $5451 as worst case for the week ahead.