
How a Peace Deal Could Fuel the Market?
Assessing Risk-On Assets, Sector Rotation, and Technical Levels Amid Geopolitical Shifts


The stock market has begun flashing consolidation signals over the last two weeks. The first warning arrived last week when the S&P 500 printed a shooting star on the weekly timeframe, while the NASDAQ posted indecisive candles just above essential resistance lines. This past Friday, the indices followed up by printing indecisive price action at overbought conditions in the case of the Dow Jones. This type of indecisive price action suggests that a consolidation phase lies ahead. Ultimately, this has been an exceptionally powerful rally, but now the market must digest its recent gains.
At the same time, we are seeing breaking positive news over the weekend regarding a potential peace deal between the United States and Iran. To navigate these developments, today’s analysis will focus heavily on technical conditions and our central weekly levels, which we always use as our primary structural tool to validate market direction: remaining above these levels confirms valid bullish momentum, while breaking below them shifts the bias to bearish momentum. While several structural charts are signaling near-term exhaustion and a healthy consolidation ahead, we will use the levels for the week ahead to objectively validate these technical signals. Our primary focus is to blend the potential geopolitical good news with strict price criteria, identifying the exact levels that must be maintained or recovered to ensure a sustainable bullish extension.
Different conditions and opportunities in our watchlist
The core question for this week centers on the flip of relative weakness: assets like NVDA, AVGO, MSFT, and GOOG are already showing vulnerability relative to their support and resistance levels, not to mention COST, and WMT. They serve as case studies for the upcoming sessions. If a peace-deal rally takes hold on Tuesday, will the upward momentum be powerful enough to help these specific names recover their lost structural levels? Will the potential deal fuel stocks like META, PLTR, NFLX, V or BRK.B that are showing constructive price action, forming a potential bullish reversal? And lastly, will the news keep XOM below its momentum line, or is it a potential long if the deal reverses?
Meanwhile, for the securities that are showing exhaustion signals yet to be confirmed and are likely to open above their central weekly levels (SPX, NDX, DIA, AAPL, AMZN, IWM, SMH), the specific lines they must defend are referenced in the charts below with their upside targets resting above the central weekly level. Those upside targets are watch out zones, since technical indicators provide advance warnings that, sooner or later, play out in the price action when a target rejects the price and central levels are lost.
TSLA, BTC, LLY, JPM are in a different cluster of securities that are worth studying for both traders and long term investors.
Today, we will break down the precise conditions for each security, highlighting the essential price levels that must hold to maintain a bullish posture, as well as the key levels that lagging assets need to reclaim. As an early indicator, Bitcoin is already reacting constructively to the headlines. Serving as a 24/7 thermometer for risk-on appetite.
Every asset features unique technical conditions and specific price levels that are analyzed individually using charts and key data points. This gives you a comprehensive view of both bullish and bearish opportunities, all consolidated into a single blueprint or dashboard to help you make informed decisions with clear targets and risk management levels.
Get access to the premium content by upgrading your subscription to the paid plan.
Let’s begin the analysis.
Today’s Agenda
Market Context: Technical charts and price levels for SPX, NDX, DJI, IWM, SMH, Volatility, Breadth, and Bitcoin.
The Momentum Map: Analyzing the stage of every security in a single chart.
Setups Blueprint: Entry levels for short and long setups with price targets and invalidation levels for all the securities in the watchlist prioritizing stronger setups.
Deep Dive: Individual analysis of Mega Caps including TSLA, NVDA, AAPL, MSFT, GOOG, AMZN, META, PLTR, AVGO, JPM, and more.
Market Context
During the week, several tech names posted bearish moves such as NVDA, AVGO, and GOOG to name the biggest ones, while stocks in defensive sectors showed green for the 5 day period as presented here:
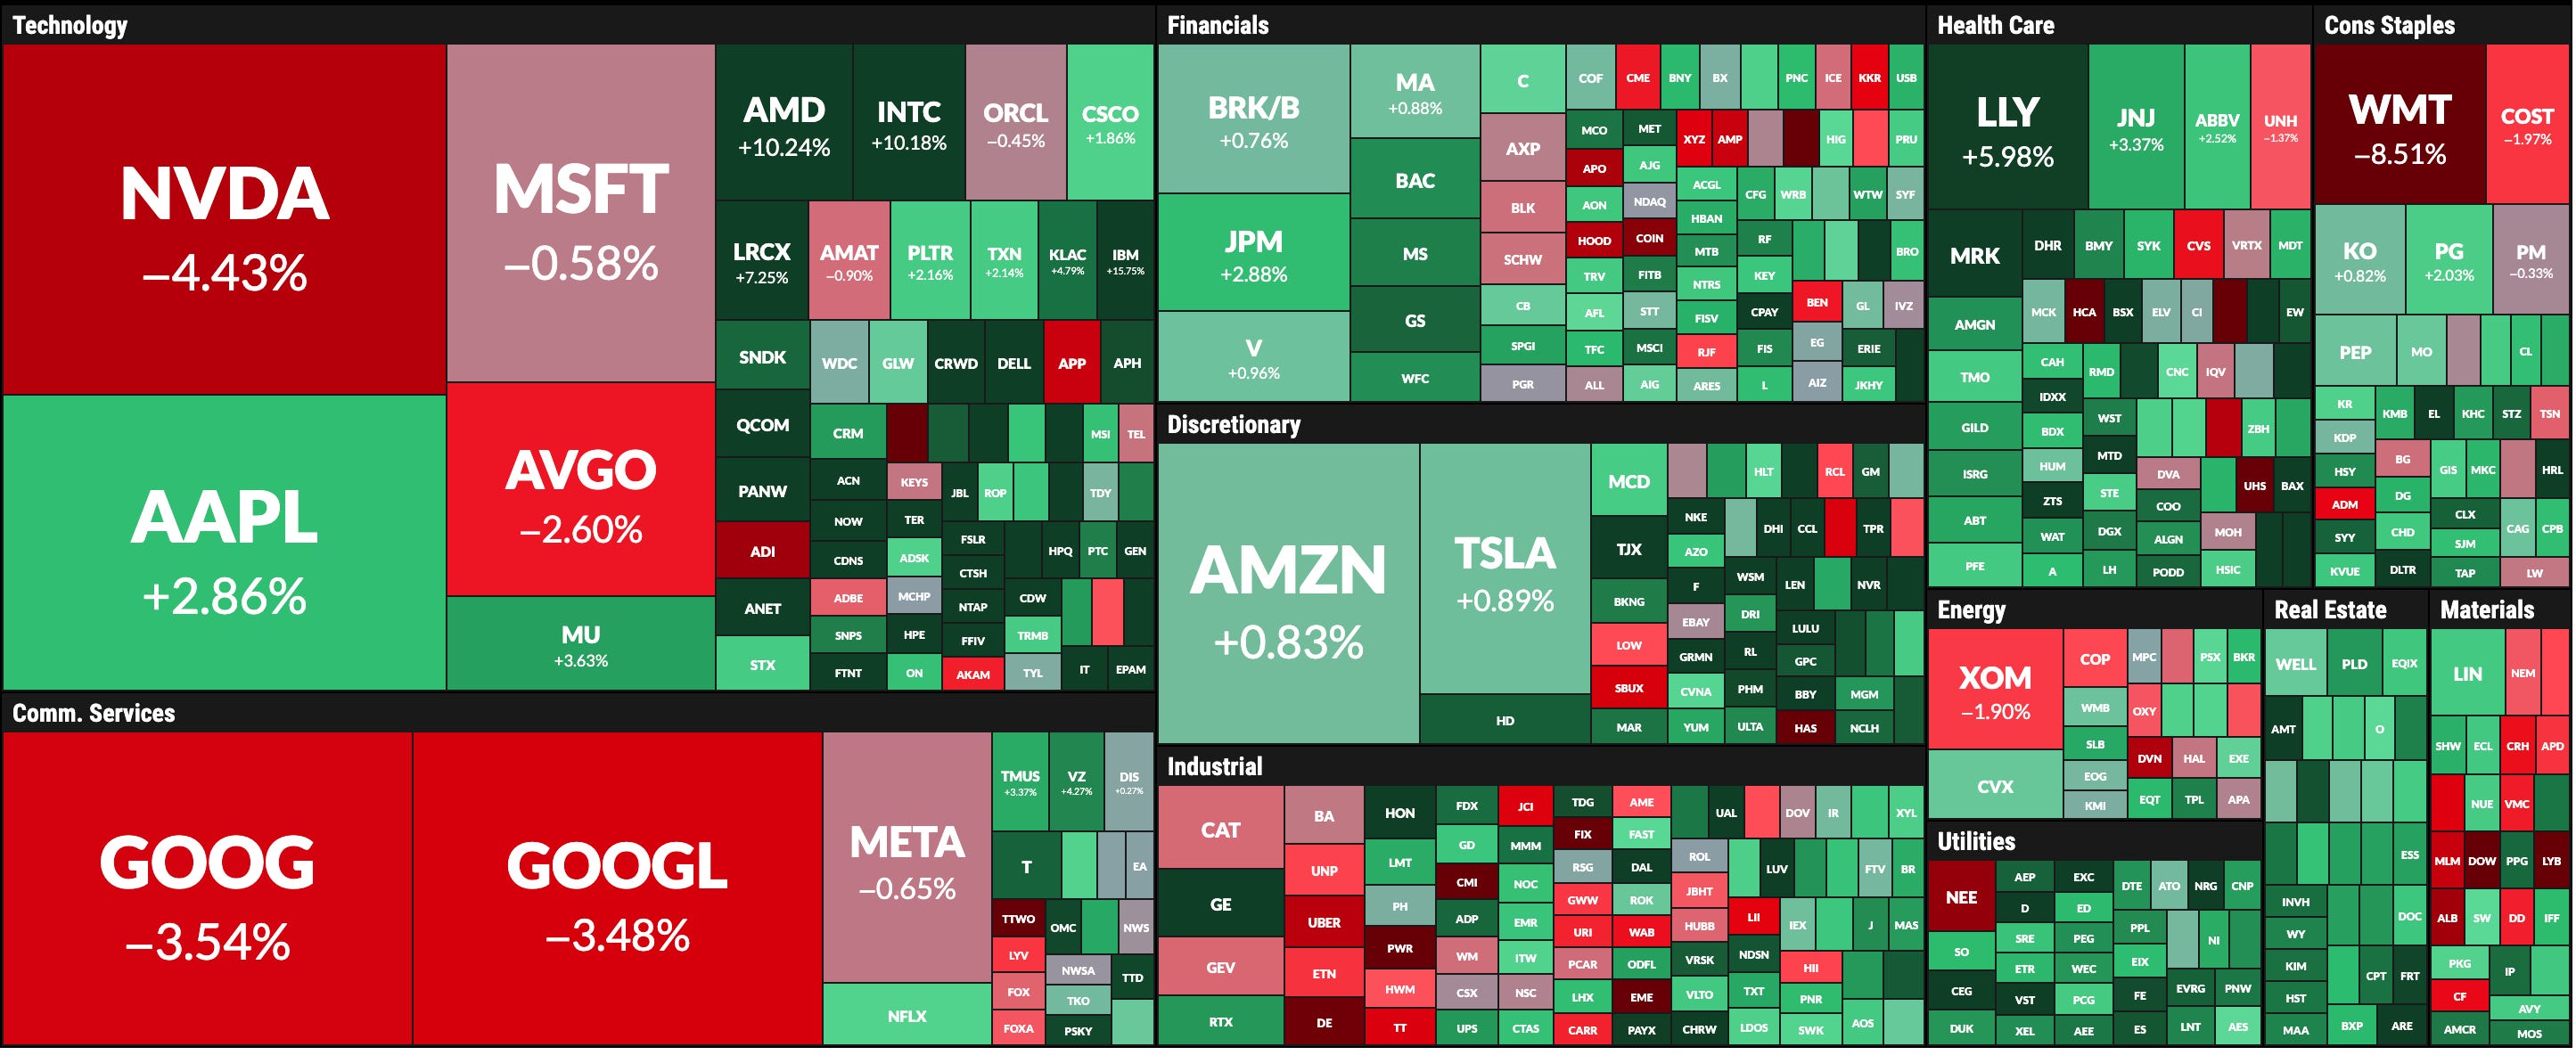
Breadth has improved, and it’s worth noting that Utilities and Healthcare as defensive sectors outperformed tech. Let’s study the trend, being mindful of internals and individual names that are showing solid setups.
SPX - Will the Good News Invalidate Exhaustion Signals?
It is a well-known market adage that bottoms are events, while tops are processes. What we are currently observing is a localized increase in volatility and choppy price action, which is a standard characteristic of broader consolidation processes. These are the bullish and bearish facts, with the indicators to monitor next week: