

The market plummeted today making real the worst-case scenario considered in the Weekly Compass during the last two weeks. With the VIX above 20, navigating this tape is already challenging, and today’s volatility spike is pushing it dangerously close to 30.
The SPX closed below the 200DMA yesterday, that was a bearish condition already. However, overnight futures action turned bullish ahead of the Anthropic IPO (ANT), it looked interesting at the opening, but also as considered in my daily note on Monday, annual revenue and other factors suggested the expected valuation was overpriced, so the flush began not long after the market opened. This is why relying on support and resistance levels is so critical, and today’s price action proves the case.
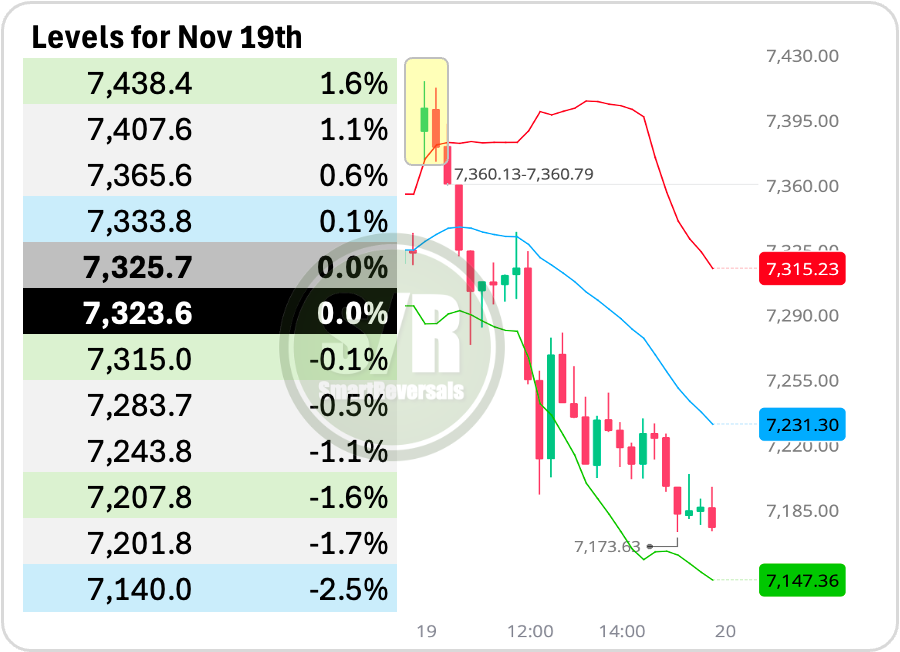
Hour by hour, the SPX gains evaporated as price broke through the modeled levels posted in yesterday’s publication one by one. Viewing the 15-minute timeframe with the combined levels for today shows the morning breakout above the 15-minute Bollinger Band (a setup we have studied previously for major opening moves). From there, the resistances that had flipped to support began to fail until the final daily level of 7,201.8 was breached, leaving price to close near the monthly support of 7,140.
Combining daily, weekly, and monthly levels provides a clear visual map of both the lines of defense and potential resistances whenever the market commits to a specific direction.
Today’s Agenda
How Damaged is the SPX Structure?
Daily plan for SPX, ES=F.
Daily and Weekly Levels Combined for SPX, ES=F, QQQ, and Semiconductors
Watchlist Tracker
How Damaged is the SPX Structure?
Today’s move broke many levels beyond the 200DMA and the 40WMA, this chart shows the last line of defense that if broken would be concerning for the next months: