
Is Winter Behind Us? Unveiling the Potential Cracks Beneath the Surface with Next Week's Indicators to Monitor
There is a Potential Healthy Pullback on the Horizon - 20+ Weekly Charts Analyzing What Technicals Are Saying. Will NVDA Earnings Keep the Rally Going?


This week delivered a bullish candlestick, signaling a continuation of the uptrend observed in the previous week. The indecisive candle on Friday, May 10th, didn't foreshadow a reversal, and prices continued to climb.
Better Than Expected CPI Report
April's CPI Report Shows Inflation Cooling Down: Prices rose at a slower pace than expected, with a 0.3% increase month-over-month and a 3.4% year-over-year increase as smaller gains in services (e.g., food services) costs offset the continued strong rises in rent and gasoline prices.. This suggests some relief from inflation, driven by lower service cost increases. While we're not quite at the Fed's 2% target yet, the slowdown is a positive step and could pave the way for potential interest rate cuts later in 2024.
Meme Mania: Short-Term Gains, High Risks
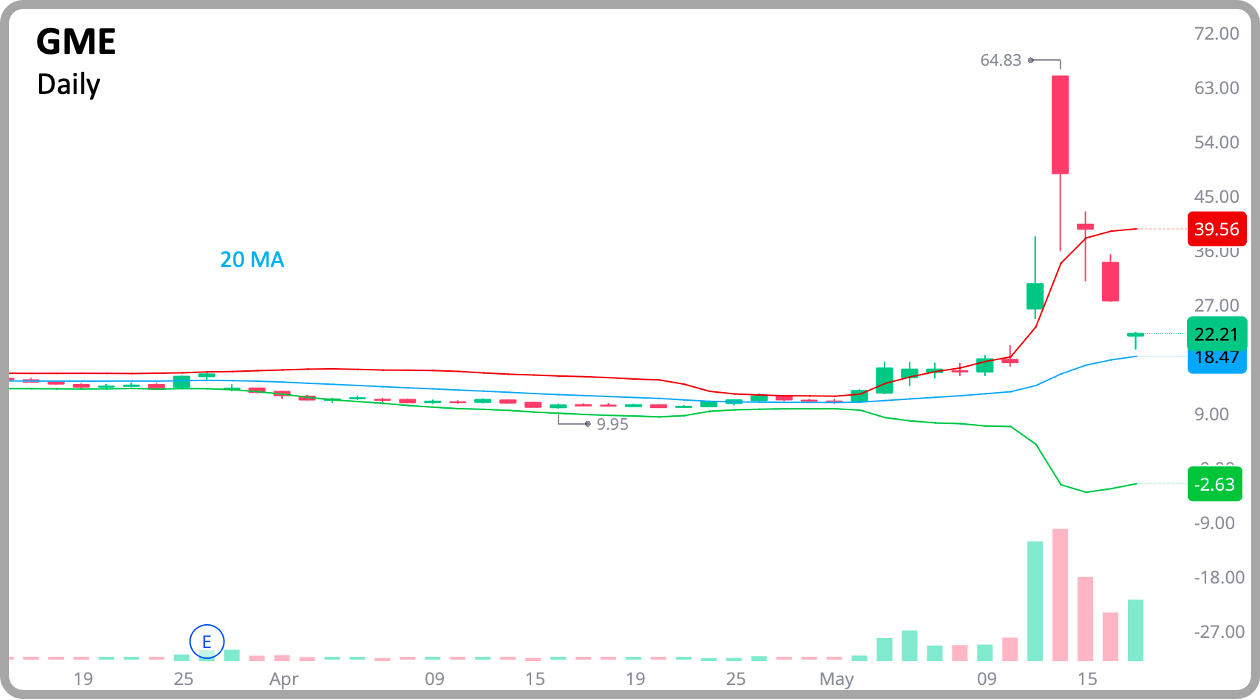
A phenomenon not seen since 2021 resurfaced – the frenzy surrounding GME and AMC. Many investors jumped in, fueling a surge in small-cap stocks. These irrational spikes are best left untamed. Day traders can capitalize on these movements by buying the stocks or using leveraged instruments. However, as emphasized in my recent educational content on fundamental analysis, these trades carry significant overnight risk.
Riding the Wave vs. Long-Term Holds
I've personally participated in such explosive surges in 2021. While it's tempting to "surf" these waves, the risk is substantial. Investors who bought GME on Tuesday afternoon, fueled by meme-mania, have witnessed a 54% decline in their capital. The situation is even worse for those who bought GME at the open on Tuesday ($64.8) and are still holding. They've incurred a 65% loss on their capital.
Ignoring Technical Signals Can Be Costly
Technical analysis also did not support this trade. As you may recall from my analysis, a price surge above the Bollinger Band followed by a shooting star candlestick pattern has a high probability of failure for long positions. While the correction might not be immediate in a bullish market, those who bought early this week fared better than those who entered later.
Fundamentals Matter: Make Informed Decisions
There's a possibility of a temporary bounce, but the fundamental ratios I shared in my latest educational content highlight the inherent risks. By understanding these factors, you can make informed trading decisions.

Regarding U.S. indexes and mega-caps, all of them look good in the surface, the last three days of the week show weak price action that may have signaled a profit taking since in the very short term there may be a visit to 10 or even 20 DMA.
However, something is helping stocks to move up, remember the emphasis in VIX that I always do, it was odd to see VIX continuing moving down after the spike in this index seen on Monday. Well, I found other two elements that are definitely sponsoring the ride and they are driving it to avoid a healthy pullback. Those two elements closed the week with a slight bounce at their support levels.
Before charting them, remember the S/R levels shared every weekend, staying above the central level (blue) is bullish, and it also invalidates bearish technical signals as it happened last week with SPX and GDX, remember the levels published then:
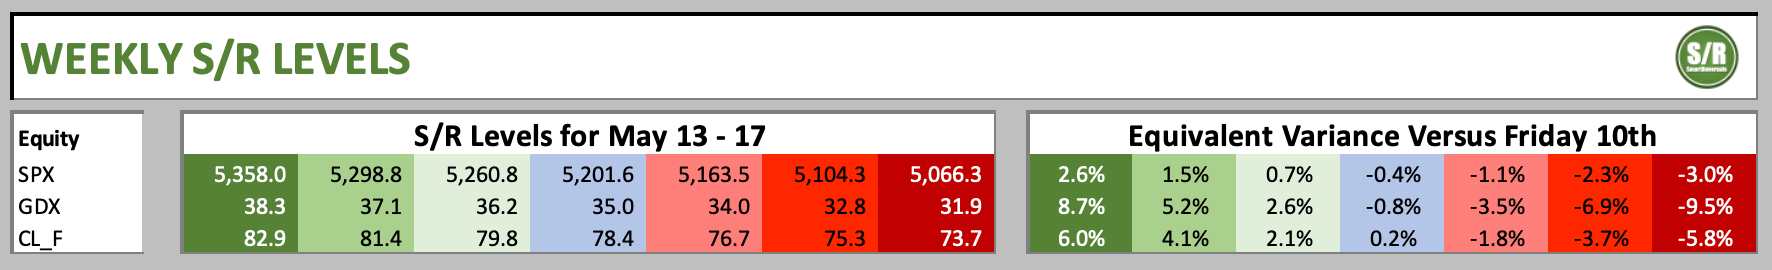
The opening on Monday 13th was above $5201 for SPX, $35 for GDX and Oil managed to recover $78.4, which suggested bullish continuation for these three examples. You can use the levels for next week in the same way after analyzing the indicators that suggest a bounce and could create cracks in the bullish pathway.

So the market is in bullish mode, the key levels to watch for some of the 20 securities analyzed are:
SPX - $5280; SPY: $526.9; QQQ - $449.4; META - $471.5… and so one for NVDA, DJI, DAX, GDX and 20 securities published. The educational content about S/R Levels indicates how to navigate the levels.
This newsletter starts with the key indicators that have helped stocks and have to be tracked next week:
MARKET CONTEXT
Here are the indicators fueling the rally that are in support zones: