
Key Elements to Watch for the Long-Term Outlook and Annual S/R Levels
Third Installment of the Annual Support and Resistance Levels


After two consecutive years of over 20% gains for the SPX, a third such year is highly improbable, given the overbought conditions on numerous charts and concerning macro indicators. This edition presents an key elements to watch for the annual outlook and the third installment of the annual support and resistance levels, which are particularly relevant in the current market environment.
The weekly S/R levels, published every Friday, have consistently demonstrated how price action tends to remain within a defined range throughout the following week. All premium subscribers receive these ranges in advance, giving them a valuable edge to anticipate reversals or to validate breakouts. Similarly, the annual S/R levels provide broad ranges within which the US indices, Magnificent 7 stocks, precious metals, Bitcoin, and other securities covered in this publication are likely to trade. These annual ranges are detailed below.
We'll begin with a short-term market update, followed by factors to consider for a longer-term outlook. The publication concludes with annual support and resistance levels for BTC, TSLA, MSFT, NFLX, MSTR, and TLT.
Access previous two editions featuring annual support and resistance levels for SPX, NDX, SPY, QQQ, IWM, GOOG, PLTR, AMD, DIA, NVDA, GLD, SLV, AMZN, META, and AAPL by clicking here: First Installment and Second Installment
The Market Today
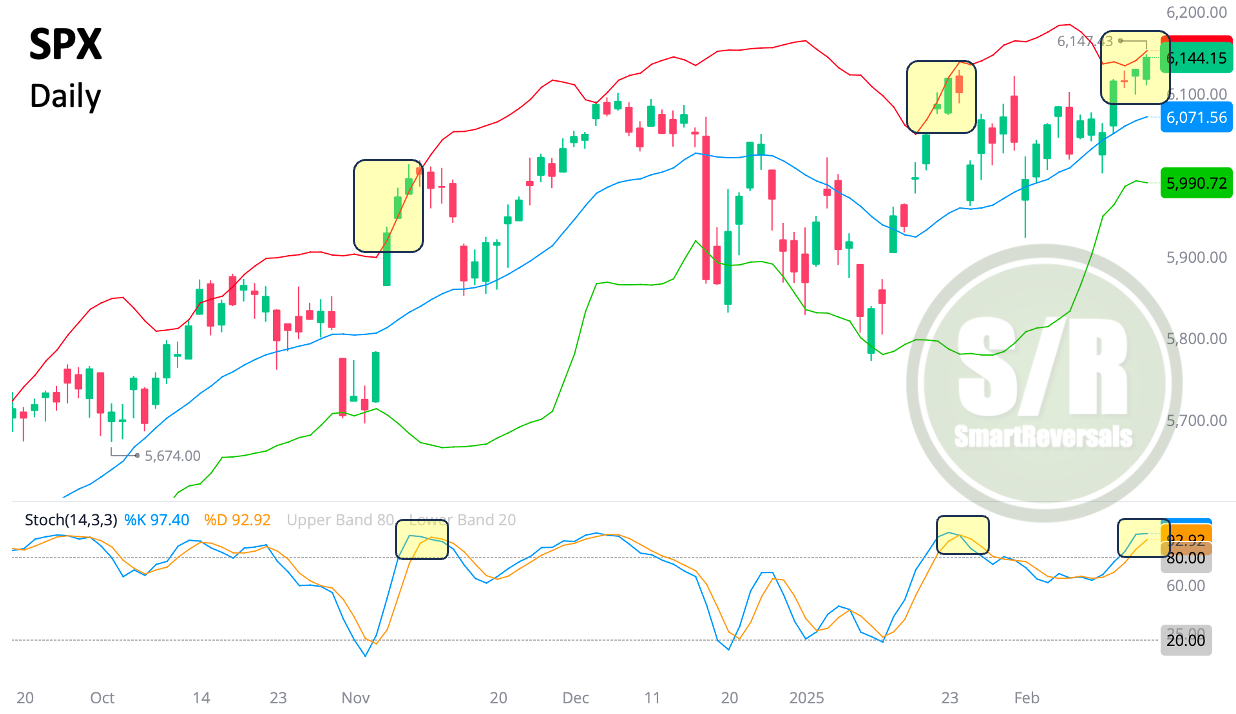
The SPX broke out to the upside today after two consecutive indecisive daily candles. The widening Bollinger Bands suggest potential for further gains. This upward move isn't entirely unexpected, as price action has remained above the key $6,082.6 central level for the week, increasing the likelihood of a move toward $6,160.4. However, caution is warranted as the oscillator is overbought and showing signs of turning downward. It's important to remember previous instances where price approached the upper Bollinger Band and the oscillator curled down, often preceding a pullback.
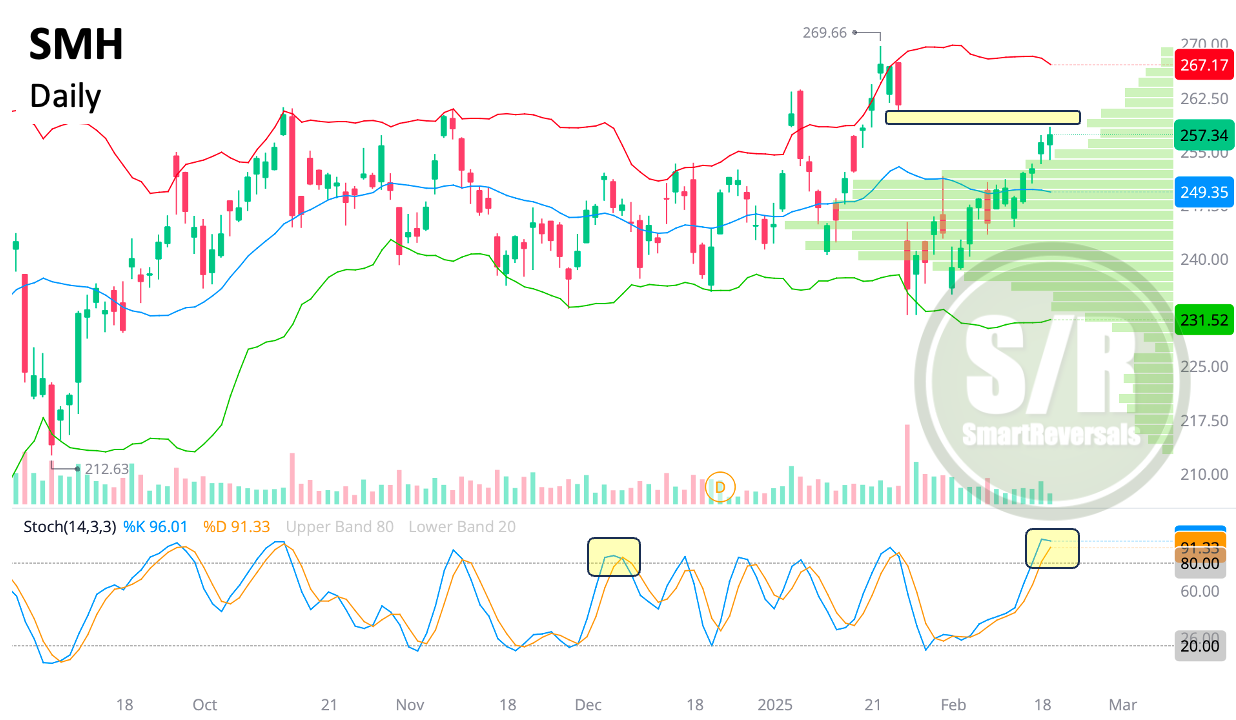
The semiconductor sector (SMH) is targeting a gap fill. However, NVDA's recent indecision (as considered in yesterday's public update) suggests caution, particularly given the $142.3 resistance level anticipated last Friday.
SMH, with a potential bearish crossover on the oscillator and price action breaking away from the volume shelf, monitoring the $255.7 level is prudent for tight risk management. If a wider range is desired, the $250.1 level becomes critical. Let’s remember that lately the pullbacks have reached the lower Bollinger band and matched a bearish weekly target.
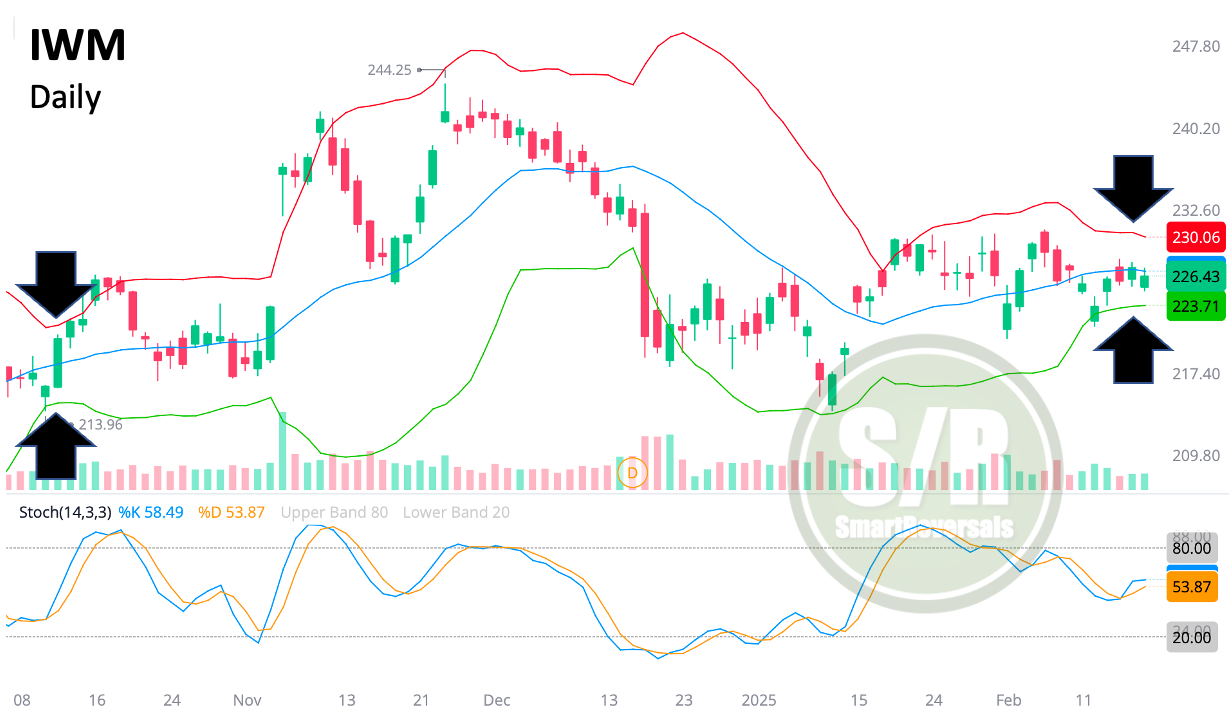
Small caps (IWM) continue to consolidate within a Bollinger Band squeeze, signaling an imminent large move, as highlighted in yesterday's analysis (see chart below). The 20-day moving average remains a key resistance level. Therefore, $225 is a crucial level to watch for bearish confirmation, a scenario strongly suggested by the weekly chart posted last Sunday. A break below $225 targets $222, while a bullish resolution (assuming the 20-DMA is cleared) targets $228.
Upgrade your subscription and unlock more market insights, including charts for the VIX and PLTR, the long-term analysis for SPX and NDX, and annual levels for BTC, TSLA, MSFT, NFLX, MSTR, and TLT.
Volatility Index (VIX)