


The final day of the year has arrived. Congratulations on your trading and investment performance. Regardless of your specific returns, be aware that you have just navigated a historically unique year; one with few precedents.
We witnessed a rapid selloff comparable in velocity to 2020, rather than the slow-motion bear market of 2022. Then, mirroring 2020 again, we saw a V-shaped recovery from a major correction, accompanied by a confluence of rare bullish events: a breadth thrust and two distinct ‘up volume’ days. We studied these events individually as they occurred, noting how statistically improbable it is to witness them all within a single calendar year.
The average active trader survives only one or two years in this business. When these rare events are experienced in real-time; rather than viewed as safe historical data points, they are often accompanied by doubt, apathy, and noise from mainstream media. But now, you have the experience. The next time these signals emerge during a recovery, you will know exactly what is coming: a powerful bullish period.
Looking ahead, 2026 is a midterm election year in the U.S. presidential cycle. Historically, these years are turbulent and often include significant corrections. This statistical tendency aligns with our current technical reality: price action has been parabolic and defying gravity for an extended period, suggesting the market is due for a reset.
By the third quarter of 2024, I published an expectation for a major market top when the S&P 500 reached $6,109, with a potential bottom measured in the $4,800 zone. The actual top occurred in February 2025 at $6,147, and the bottom formed at $4,835.
The precision of this forecast was impressive. It did not stem from subjective opinion, but from a disciplined study of price action and chart structure. A couple of months ago, I applied this same methodology to a new study assessing price action for the SPX and NDX. This analysis evaluates the current market structure and identifies the specific price zone where the next major top is expected. You can access the full analysis here:

Let’s continue with today’s market update including SPY, QQQ, VIX, Bitcoin, NVDA, Silver ETF SLV, and the assessment of the high probability setups posted on Sunday (TSLA, AAPL, AVGO, COST, NFLX). Upgrade your subscription to unlock all content.
SPY - Price Action Confirms Friday’s Indecision
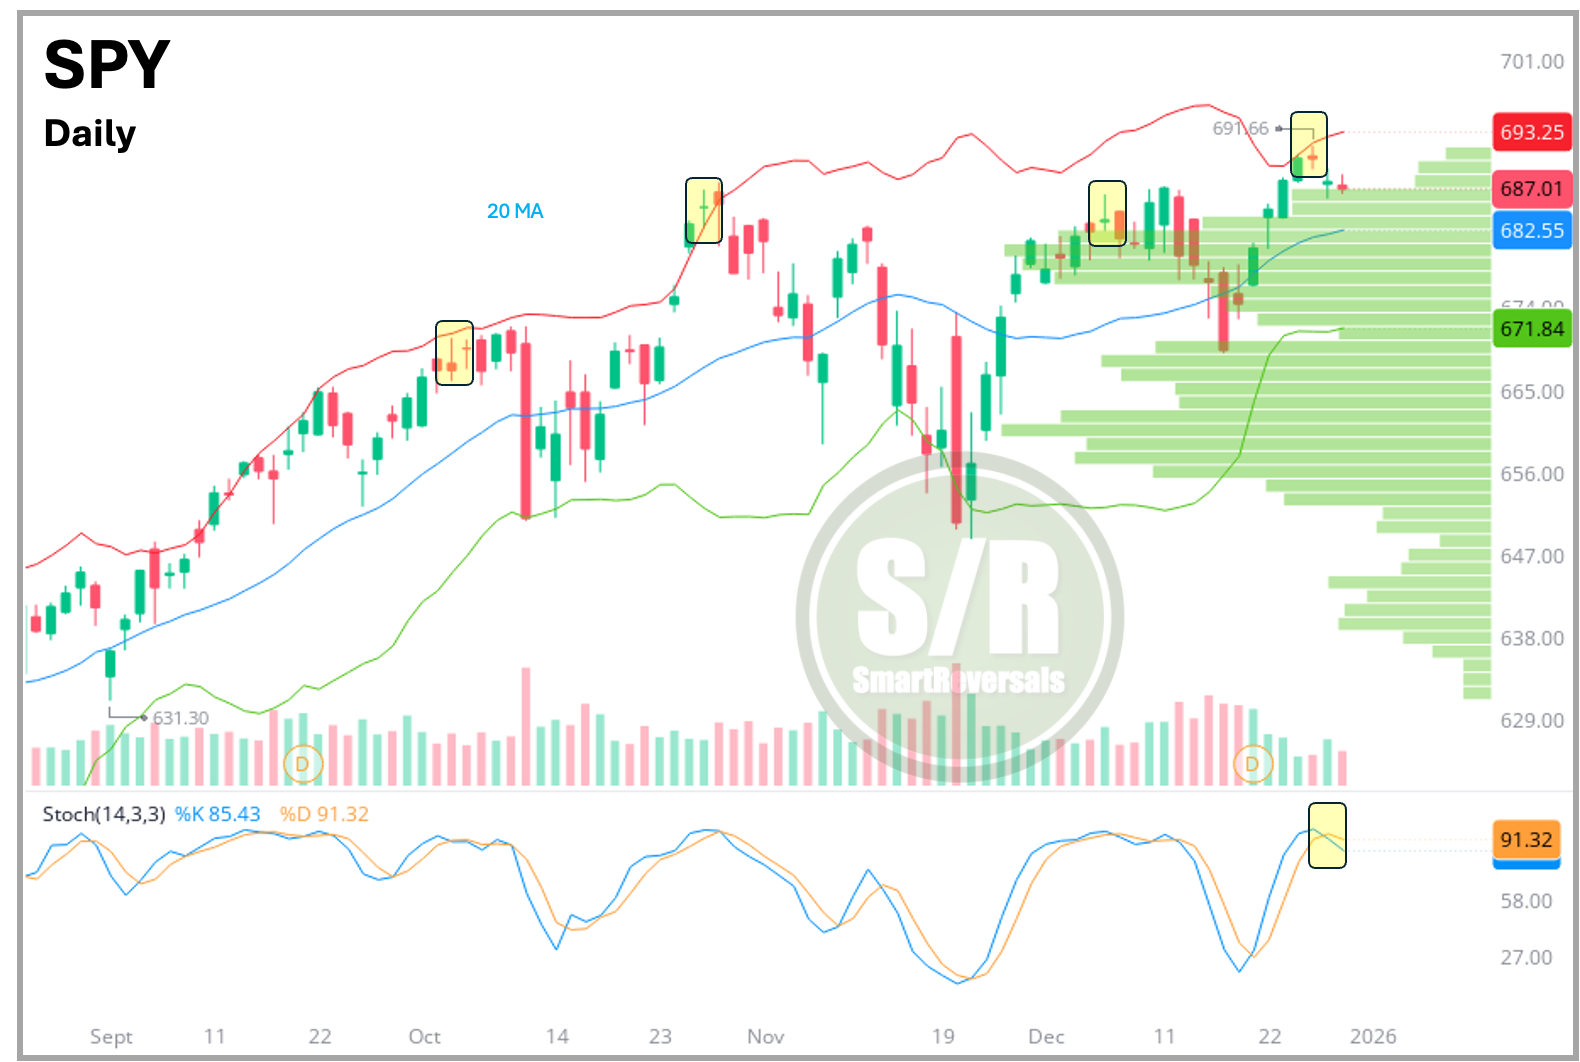
The Weekly Compass (weekly timeframe) and the chart posted in the chat over the weekend (daily timeframe) both highlighted the need to focus on the CWL (Central Weekly Level). This attention was warranted not only by the recent indecisive price action highlighted again in today’s chart (above), but also by considering the following aspects: