

Both the SPX and the NDX posted its first winning week after four weeks of losses gaining 2.5% and 3.5% respectively, in my daily note on Wednesday I highlighted the resistance zone that could reject the bounce, and that is what happened.
Looking at my anticipated bullish setups for the week, AMD exceeded its weekly level of 567.7 rallying 26% versus previous Friday, SPCX reached its bullish target of 144.5 for a 7.7% move, GOOG made it to 294.9 for a 3.9% gain, and SMH hit 515.9 for an 11.2% run.
The week had a solid bullish move, non-tech giants like LLY, WMT, and V did not decline despite the tech rally, the last two were indecisive during the week and had a green day on Friday when tech retraced from weekly resistances.
NVDA stayed all the week below its central weekly level, no bullish reversal was triggered, on the contrary the stock is oversold as not seen since April 2025, my daily note on Thursday presented the case and today as every Saturday we will cover NVDA in the momentum map, its indicators and price targets, and a special fundamental immersion.
Subscribe and unlock the high probability setups for next week, these bullish calls came last Saturday in the middle of major pessimism in the market, I have also posted longer-term setups that are playing out very well this month, today I will highlight the best candidates for December’s bullish reversals. All my setups come with clear risk management references based on modeled support and resistance levels where institutional algorithms have proven to react.
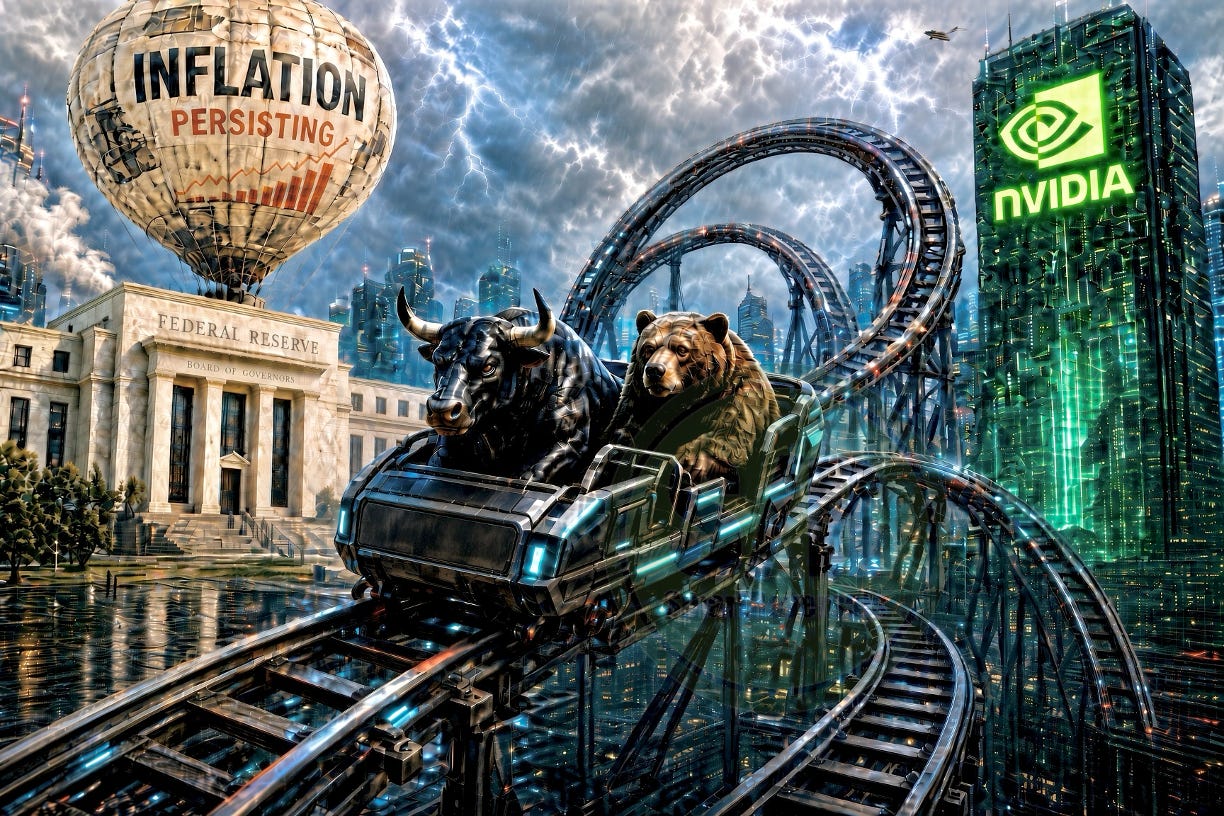
100% Probability Rate Hike in December: During the week, the Consumer Price Index (CPI) showed that prices rose 0.4% in October from the month before, above the 0.3% forecast. Core CPI, which leaves out food and energy because their prices swing the most, rose 0.3% against an expected 0.2%. It was the third month in a row that core inflation came in hotter than expected.
The Producer Price Index (PPI) showed that wholesale prices rose 0.3% in October from the month before, slightly under the 0.4% estimate, that sound good, but the yearly number is up 6.5% from a year ago, the highest annual wholesale inflation rate since November 2022. Core annual PPI also stayed hot at 5.0%, which raises the concern that producers will pass their persistent supply-chain costs on to consumers heading into 2027.
Following Inflation reports and hawkish Fed officials, the probability of a rate hike this December is 100%: 25 basis points at 88.5%, and 50 basis points, at 11.5%. Fed Governor Christopher Waller said a 50 basis point move should be considered if core inflation stays stubborn. The market gives it a small chance for now, and those odds could rise if the upcoming employment and energy data stay hot.
There is no doubt that the market is still in a turbulent zone. Today, I will analyze the momentum map to break down the status of each ticker on my watchlist, differentiating which ones are in bullish or bearish momentum. I will also cover technical chart analysis for market direction and detail the setups for every ticker on the watchlist:
Indices & Futures: SPX, NDX, DJI, IWM, ES=F, NQ=F
ETFs: SPY, QQQ, SMH, TLT, GLD, SLV, DIA, VXX
Major Stocks: AAPL, MSFT, GOOG, AMZN, NVDA, META, TSLA, SPCX, LLY, WMT, AVGO, COST, JPM, XOM, PLTR, NFLX, V, AMD
Crypto & Related: Bitcoin, Ethereum, ETHA, IBIT
Leveraged ETFs: TQQQ, SQQQ, UDOW, SDOW, UPRO, SPXS, URTY, SRTY
My SmartReversals Investment Framework is the structured approach that helps you making informed decisions.

Subscribe to the paid plan using this week’s special coupon:
Today’s Agenda
Special Fundamental Zoom In on Nvidia: Includes Downloadable PDF analysis
Market Context: Charts+levels for SPX, Indices, ETFs, VIX, Breadth, and Crypto.
Momentum Map: Analyzing the stage of every security in a single view.
Deep Dive: Individual charts and targets for megacaps and ETFs.
Setups Blueprint: Entry levels for short and long setups with price targets and invalidation levels for all the securities in the watchlist prioritizing stronger setups.
Let’s begin.
Fundamental Zoom in to NVDA: Buying Opportunity?
There is so much noise about the stock, here is the complete fundamental picture, what to watch in the next earnings report, and the target price: