
Market Action: Selloff Start, Mid-Week Bounce, End-of-Week Retracement
S / R Levels - February 10th - 14th


This week's market action has seen some deceptive bullish moves, potentially trapping investors caught up in the AI hype and overlooking the growing likelihood of a pullback.
As highlighted in last week's Weekly Compass click here, several bearish or consolidation setups have now been confirmed, with the following weekly variances: TSLA (-10.5%), Bitcoin (-5%), GOOG (-8.8%), AMZN (-3.6%), AAPL (-3.2%), and MSFT (-1.5%). Conversely, anticipated bullish probable moves have materialized in GLD (+2.3%), SLV (+1.7%), and NVDA (+7.0%). SMH and IWM have seen flat movement after reaching bearish exhaustion.
While META is currently trading above its technicals, this is supported by strong earnings. PLTR, following similarly robust results, is exhibiting even stronger momentum reminiscent of NVDA's performance last year. Fundamental updates on both META and PLTR have been published (link here click here for some of the Mag 7 fundamental update).
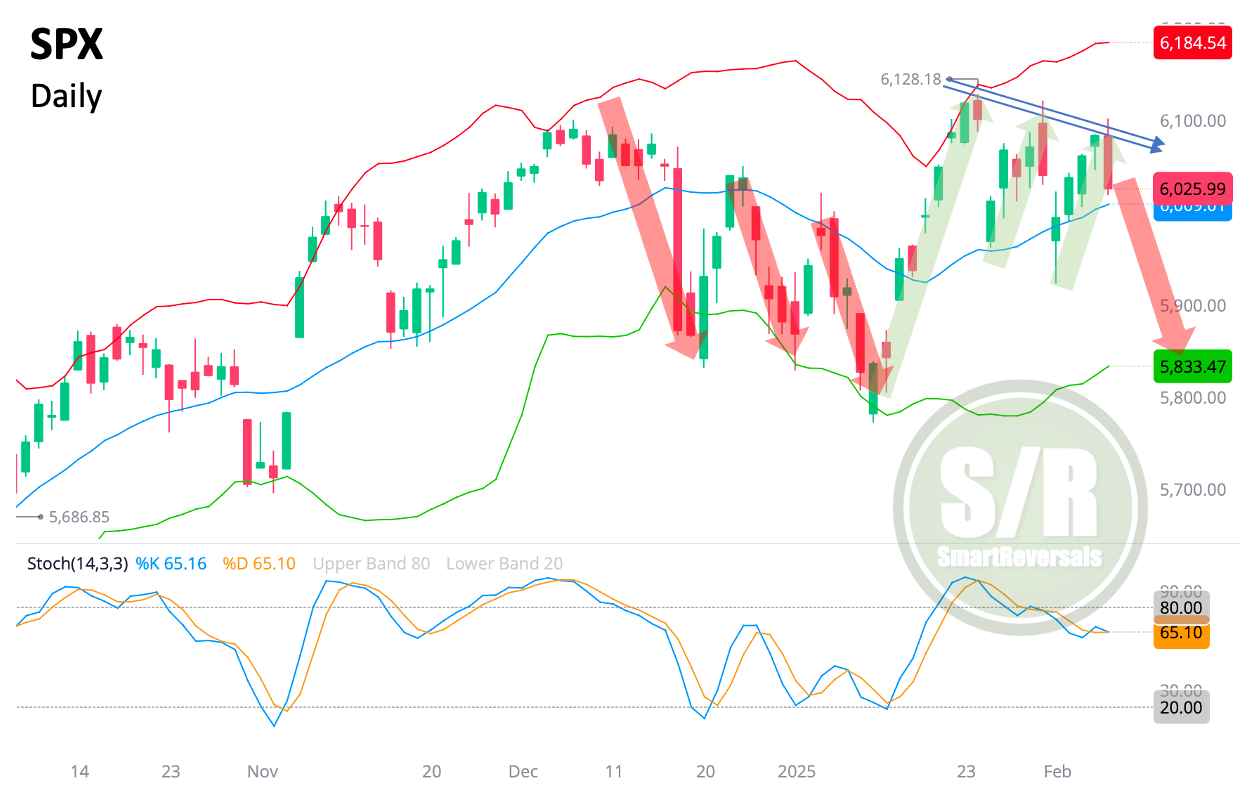
Regarding SPX, the second support level was neared, remember the note from last weekend’s edition: “Immediate target for bearish continuation: $5962. And $5920 has to be considered”, and if the central level $6043 is recovered, and the Potential bullish reversal target if the key level is recovered: $6120
The week's low was $5923 and the high $6101, providing a solid range for the week's price action, REMEMBER: Those levels were posted one week ago, before the actual price action. The key question now is the sequence of events, and this is precisely where the current market has proven so challenging for bullish investors.
The SPX's expected trajectory, based on the weekly setup analysis (update to be posted tomorrow with 20+ charts), is shown below. However, the market's early-week selloff, followed by a bullish move, has so far proven to be a false signal during two weeks. (the blue line is the central level).
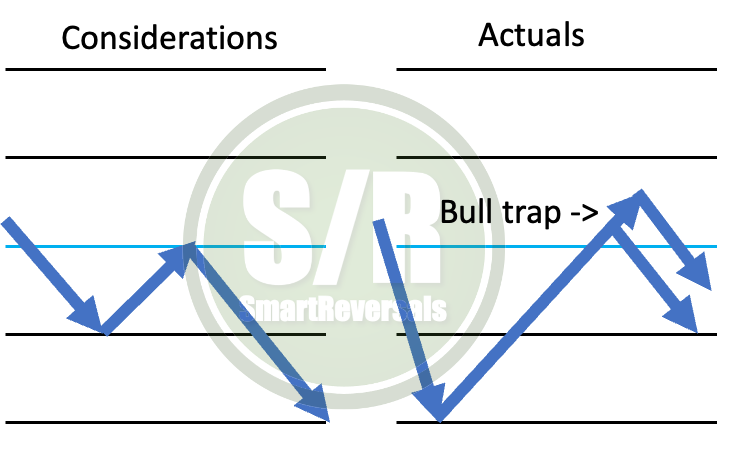
The week closed essentially flat, remember what I noted two days ago about the marginal move so far despite of the three bullish candles (access here), the thesis of a green Thursday with a weak candle was proven true and also the decline on Friday following the sequence of Dec 26th.
The diagonal charted yesterday acted as resistance, the series of lower highs has not even neared the upper Bollinger band, showing weakness in the bounces. If this pattern continues, a bearish continuation is coming. During the last two weeks the market has tricked investors with some euphorias (PLTR), while most of the Mags 7 are falling (GOOG, AAPL, AMZN, TSLA, MSFT).
The 20MA (blue line) is key, but even more $6017; if that level is breached next week, a bearish continuation is likely.
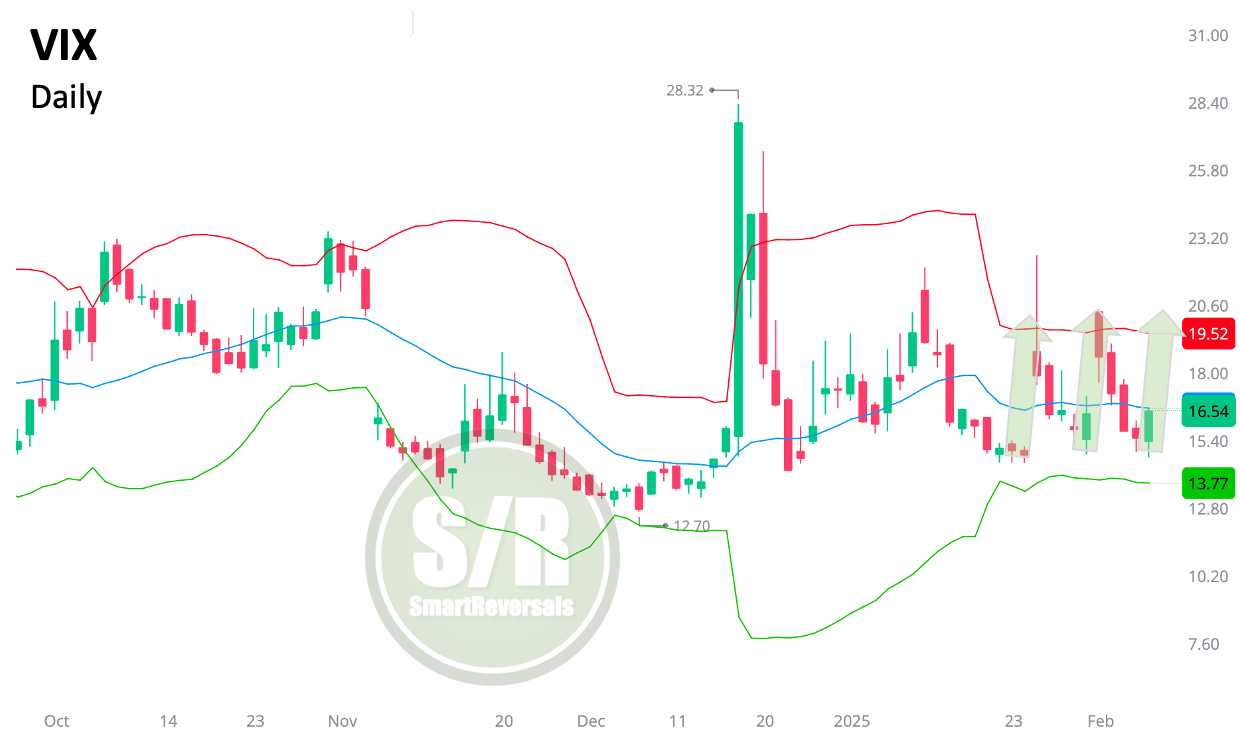
The Volatility index suggests bearish continuation for the S&P 500, considering the bouncy chart. For third Friday in a row the pattern seems bearish for stocks.
ES=F: Bearish validation if $6,036.6 is breached || The potential bearish target if the key level is breached is $5,949.9 || And if there is bullish continuation without a breach, the Immediate target is: $6137.2. If that last scenario occurs, caution is key at the bullish target.
This publication covers 35 securities in the charts below: SPX NDX DJI ES=F NQ=F SPY QQQ IWM DIA SMH TLT TQQQ SQQQ UPRO SPXS UDOW SDOW URTY SRTY NVDA META MSFT AMZN GOOG AAPL TSLA NFLX COST MSTR PLTR AMD GLD SLV BITCOIN and ETHEREUM. If you trade some of them, this publication is for you.
SPY, QQQ, DIA, and AMD; with same commentary structure, and tomorrow 20+ charts with the technical context and price targets.
Some popular securities like Bitcoin and Tesla, with recent rallies anticipated by this publication in September and October respectively, both have triggered key signals that you don’t want to miss.
WEEKLY LEVELS