
Market at Crossroads - VIX Versus McClellan Oscillator
Conflicting signals from the VIX and McClellan Oscillator make this week a critical turning point.

The Volatility Index (VIX) continues to hold above 15, a key threshold. When the VIX is below this level, the S&P 500 tends to see stable moves. When it’s above, as it is now, we typically see choppy price action. On Friday, the index reached 29—a significant spike. Technically speaking, this was an extremely overbought condition, which explains the sharp -17.9% reversal that same day. Even with that drop, the VIX still closed above 20.
Today’s Agenda:
In the content below, we’ll study that VIX reversal and the McClellan Oscillator. As I posted last Sunday, the oscillator closed in deeply oversold territory on Friday, October 10th, which made the bounce on Monday, October 13th, a very likely scenario. Recently, oversold conditions like this one have often set a bottom. However, since the price action didn’t see significant bullish continuation during the week (which the VIX spike helps explain), the bounce was choppy.
The technical charts for the indices show that a key moving average has been breached. According to previous occurrences, the loss of this average has often brought turbulence.
Among the securities we study, the weakness in Bitcoin is notable. We’ve been tracking how the cryptocurrency has initiated trend reversals over the last few years.
AMZN remains weak, just as the technicals in previous publications suggested. PLTR and NFLX continue to struggle, showing indecisive price action that suggests caution.
AAPL continues to look constructive, as its long-term setup suggests. GOOG, MSFT, and TSLA held strong at key volume and annual levels; these four can support the market if they remain strong through earnings season. More details on the specific levels to watch, as well as the cautionary signals TSLA is still flashing, are analyzed below.
META remains weak, as anticipated, and is trying to find support at our key annual level. It’s showing a similar structure to WMT before its recent breakout. NVDA is on major watch, considering the bearish weekly shooting star it printed last week, which has not yet been invalidated.
Metals continue soaring, but this coming week may be different. SLV is showing a significant signal that may anticipate a reversal for both it and GLD.
IWM is showing a setup similar to AAPL’s. In this case, it’s not backed by strong fundamentals like the tech giant, but the price action is following the script of a major long-term formation we have been analyzing.
For a subscriber, the benefit of constantly analyzing the same universe of securities is the ability to see rotational opportunities. Not all stocks are in the same phase of a trend. The following rotation map shows the current position of each security we study relative to the SPX:
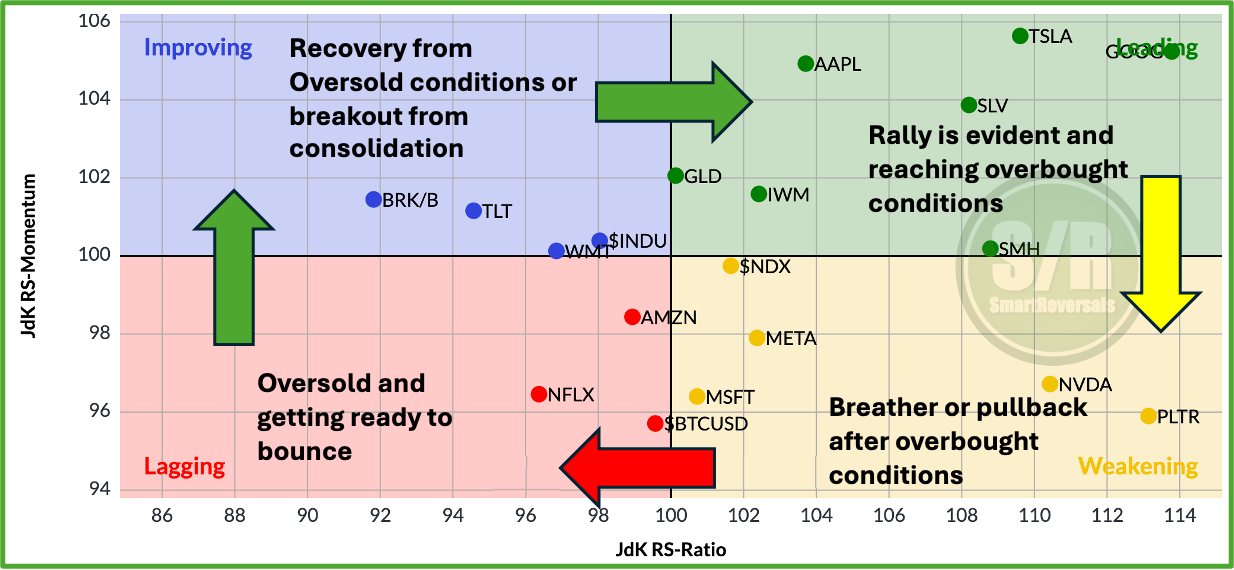
Premium subscribers may remember when I posted this map for the first time around July. Back then, AAPL was in the red quadrant (Lagging), TSLA was in the blue quadrant (Improving), and PLTR and META were shining in the green one (Leading), while AMZN and NFLX were in the yellow one (Weakening). Only time can highlight the importance of this map. As mentioned before, rotation is a process, and this publication brings you the charts for each of those securities, complete with the technical indicators and specific levels that suggest either caution or optimism.
Technical indicators and S/R levels do not work separately:
An S/R level is not a guarantee of a reversal if the technical indicators still show strong momentum. Likewise, a technical signal may be invalidated if the specific support or resistance level included in the analysis is not breached. Be mindful of that.
That said, let’s include in our map the securities analyzed each Friday with the levels, the current picture suggests having LLY and COST on watch like NFLX, while being cautious with AVGO, AMD, and ETH, as the chart below presents. See JPM next to META and AMZN.
Before continuing, securities that premium subscribers suggested to analyze based on levels are posted in the premium chat.
Rotation Map and SPX vs McClellan Oscillator in Previous Occurrences