
Market Instruments Explained
The Modern Investor's Toolkit - A Guide to Stocks, ETFs, Options, Cryptocurrencies, and More


Navigating the financial markets is much like being a skilled craftsman approaching a complex project; having the right tool for the job is paramount to success. The stock market offers a vast and diverse toolkit, with a wide array of financial instruments designed for different purposes, time horizons, and risk appetites. Choosing the correct one is the first and most critical step in any investment or trading strategy. Every investor and trader must understand which tools are right for their unique financial goals.
It is essential to first recognize that these instruments exist on a broad spectrum of risk. At one end, there are highly speculative tools like options, penny stocks, and leveraged ETFs. These instruments offer the potential for rapid, outsized gains but carry a correspondingly high risk of significant, and often total, loss. They are the power tools of the financial world—incredibly effective in the right hands for a specific job, but dangerous without proper expertise. On the other end of the spectrum are instruments known for their lower volatility, such as bonds and certain mutual funds with conservative strategies. These are the sturdy, reliable hand tools designed for steady, long-term construction and wealth preservation.
Before selecting an instrument, every person must first ask to her/himself a series of personal questions. The most important is: Why am I investing? The purpose dictates the path. Is the goal rapid capital growth to fund a specific purchase in three years, to generate a regular monthly income (for people dedicated to trade), or is it to generate a steady stream of passive income to supplement the retirement? The instruments used for these objectives are fundamentally different.
This leads to the question of when my goal needs to be met. An investor in their 30s with ambitions to retire early has a multi-decade time horizon, allowing them to take on more risk and utilize growth-oriented instruments. In contrast, an investor in their 60s preparing to live off their savings will naturally prioritize capital preservation and income, leaning heavily on lower-risk assets.
Finally, each instrument demands a different level of knowledge and engagement. Instruments favored by active traders, such as individual stocks, cryptocurrencies, options, and leveraged ETFs, require a deep understanding of technical analysis to manage entries, exits, and risk across various timeframes—from minutes to months. However, no instrument absolves you of the need for fundamental knowledge. Whether you are analyzing a specific company, an ETF that tracks a particular sector, or a REIT exposed to the real estate market, a foundational understanding of what you own and the economic forces that drive its value is non-negotiable.
In the sections that follow, we will explore each of these instruments in detail:
Stocks
ETFs
Leveraged ETFs
Options
Futures Contracts
Cryptocurrencies
Mutual Funds
Bonds
Real Estate Investment Trusts (REITs)
Penny Stocks
Following this educational content, our premium analysis begins—featuring the latest market commentary and all updated support and resistance levels for 40+ securities including SPY, QQQ, IWM, DIA, TQQQ, UPRO, NVDA, TSLA, AAPL, and many more. Unlock this exclusive content and more by upgrading your subscription to paid.
1. Stocks (Direct Ownership)
Buying a stock (also called a share or equity) means someone is purchasing a small piece of ownership in a single, publicly-traded company. The buyer becomes a part-owner, or shareholder.
The profit is in two main ways: capital appreciation (if the stock price goes up and is sold) and potentially through dividends (a share of the company's profits paid out to shareholders). The investment has a 1-to-1 relationship with the company's performance.
Ownership: Direct ownership in the company, which usually includes voting rights on corporate matters.
Leverage: None. The potential loss is limited to the initial investment.
Risk: The investment is tied entirely to the success or failure of that one company.
Best For: Investors who believe in the fundamental strength of a specific company, and traders of all styles (position, swing, day) who base their decisions on technical analysis across various timeframes (monthly, weekly, daily, hourly, minutes).
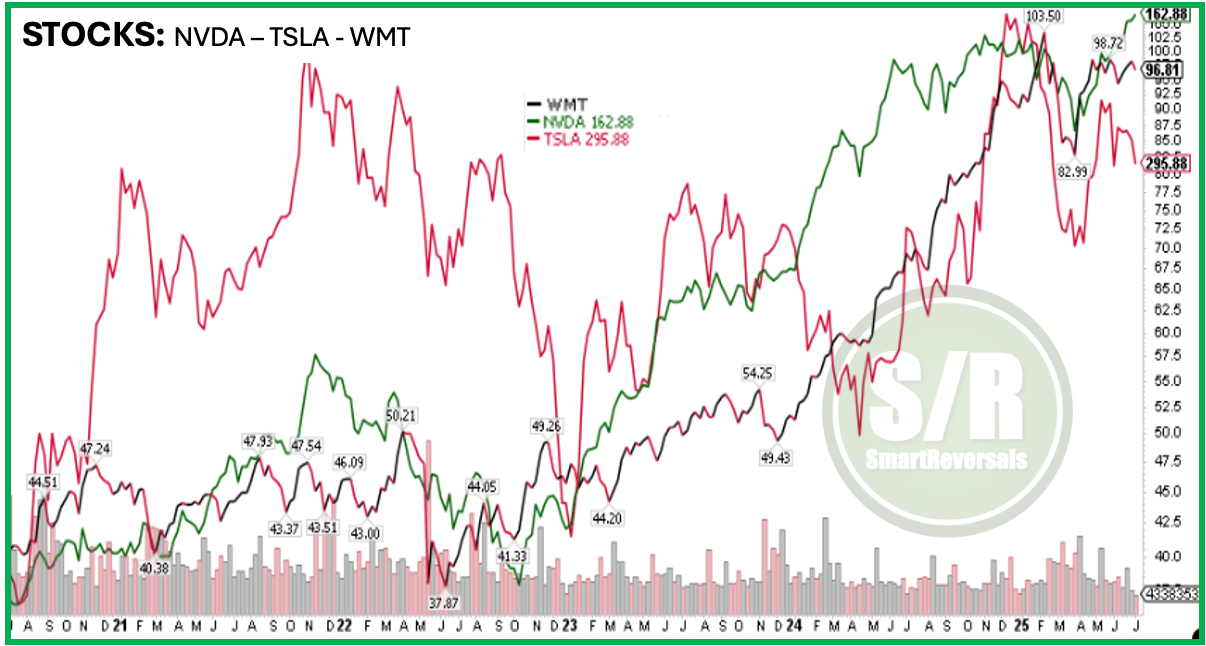
Every stock has its own personality. Even within a strong bull market, some individual stocks can get punished while others become overextended.
The chart below, which uses a logarithmic scale, perfectly illustrates this by comparing three different stocks. It highlights the euphoric rally in TSLA during 2020-2021, which was followed by a significant decline. It also shows the major run NVDA experienced in 2023 and 2024. On the other hand, a less volatile stock like Walmart also had a significant bull run during the same period, but with much lower volatility.
The point is that price action is unique to every stock. While the fundamental context drives the long-term price, technical analysis helps us time potential bullish and bearish reversals.
This is why "marrying" a single stock has both benefits and significant costs. A healthier approach is to analyze a diverse set of securities, hence the diverse set of stocks analyzed in this publication including Indices, Stocks, Commodities, Bitcoin, Bonds, and the volatility itself. This allows traders and investors to monitor the market for the best risk/reward opportunities while avoiding the individual stock blow-ups that can happen at any time.
2. ETFs (Exchange-Traded Funds)
An ETF is a fund that holds a basket of dozens or even hundreds of different stocks but trades on an exchange just like a single stock.
Instead of buying individual shares of many different tech companies, for example, a trader or investor can buy a single share of a tech-focused ETF (like XLK). This gives instant exposure to the entire sector. ETFs can track broad indices (like SPY for the S&P 500), specific sectors (like SMH for semiconductors, or XLU for utilities), commodities (like GLD for gold, SLV for silver, or USO for Oil), or other themes (like MAGS for the magnificent seven, IBIT for Bitcoin, or inverse ETFs like SH for SPY or PSQ for QQQ which behave in opposite way than the others).
Ownership: The buyer own shares of the fund, not the underlying stocks directly.
Leverage: None (for standard ETFs).
Risk: Inherently diversified. The poor performance of one or two stocks in the fund has a much smaller impact on your overall investment.
Best For: Investors seeking broad, diversified exposure to a market, sector, or investment theme without having to pick individual company winners and losers, and traders who base their decisions on technical analysis of any timeframe like position, swing, or day traders. ETFs often have lower fees than mutual funds.
This example presents the ETFs for the S&P 500, Nasdaq 100, and Russell 2000. Although these indices generally move in a synchronized way, it's crucial to navigate periods where one may become overextended relative to the others.
Over time, market leadership can rotate. For example, small caps showed periods of strength in 2020 and 2021, whereas the recent bull market has been driven mostly by tech.
The chart below focuses specifically on the RSI for SPY, highlighting how oversold conditions have consistently coincided with market bottoms, which are then followed by bounces of varying magnitudes.

3. Leveraged ETFs
A specialized type of ETF is designed to provide a multiple (typically 2x or 3x) of the daily return of its underlying index or stock. There are also inverse leveraged ETFs, which aim to deliver the opposite of the daily return. If the S&P 500 goes up 1% in a single day, a 3x leveraged S&P 500 ETF (like UPRO) aims to go up 3%. Conversely, if the S&P 500 falls 1%, the ETF will fall 3%. SQQQ is a leveraged-inverse ETF for QQQ, which gains 3% if the QQQ falls 1%, same as SRTY for IWM, or SDOW for DIA.
This instruments may look attractive when there is a clear trend, but when the leverage is against the trend (like owning SQQQ when the market is in a solid uptrend) the losses are increased twice or three times depending on the ETF considered.
Beyond broad market indices, traders can also use leveraged ETFs to make magnified bets on individual stocks. For popular names like Tesla, an ETF such as TSLL aims to deliver twice the stock's daily return. Conversely, an inverse ETF like TSLQ is designed to provide twice the opposite of Tesla's daily performance.
Similarly, for NVIDIA, there are instruments like NVD3 offering 3x daily leverage for bullish bets, and inverse products like NVD, which seeks to gain 2% on a day when NVDA stock loses 1%.
Ownership: You own shares of the fund.
Leverage: Built-in and significant (2x or 3x).
Risk: Extremely High. Because these funds reset their leverage daily, their long-term performance can "decay," especially in volatile or sideways markets. A week of up-and-down price action can result in losses for the leveraged ETF even if the underlying index is flat.
Best For: Sophisticated, short-term traders making a high-conviction bet on a specific direction over a very short period. They are not suitable for long-term, buy-and-hold investing.
The chart below compares the performance of the S&P 500 ETF (SPY) with its 2x leveraged (SSO) and 3x leveraged (UPRO) counterparts.
While leveraged ETFs look fantastic in bull markets, they can be difficult to endure during drawdowns, leading to severe losses. For this reason, a trader must be technically skilled and have a firm grasp of risk management.
This is why this publication provides support and resistance levels every Friday for the primary long and inverse ETFs covering SPY (UPRO/SPXS), QQQ (TQQQ/SQQQ), IWM (URTY/SRTY), and DIA (UDOW/SDOW). Click here for access.
When a technical setup presents a high probability for a directional move, a skilled trader can use these instruments effectively by carefully managing their risk.

Leveraged ETFs are part of the support and resistance levels published every week.
The following table provides a summary of the different ETFs, so you can compare the returns per year since 2018, and measure the drawdowns of the long-leveraged ones when there is a bear market; gaining three digit returns in 2023 using the TQQQ leveraged ETF looks good, but stomaching -79% loss in 2022 is something that must be considered and that’s the reason why leverage should be used with advanced technical knowledge, and managing risk measuring the exposure.
Options, Futures, Crypto,
ETFs - Historical Performance References (Regular - Inverse - Leveraged)