

In his first keynote address at the Jackson Hole Economic Policy Symposium, Federal Reserve Chairman Kevin Warsh delivered a hawkish tone centered heavily on price stability:
Inflation Focus: Warsh stated that with the Fed’s preferred inflation gauge sitting at 3.7%, prices are running too far above the 2% target. He warned, “We must be confident that underlying inflation is moving to our objective, clearly and at sufficient speed. Otherwise, we have work to do.”
Monetary Tool Reaffirmation: He clarified that short-term interest rates remain the Fed’s principal tool to combat price pressures, and noted he would be “hard pressed” to describe current financial conditions as restrictive.
Limiting Forward Guidance: Warsh advocated for a “quieter” central bank that avoids overcommitting to future decisions, stating that excessive forward guidance “risks creating ambiguity in the name of clarity.”
Following the speech, the markets adjusted to the likelihood of higher-for-longer monetary policy, just yesterday, the probability for a rate hike in September was 36%, today the number sits at 57%. Short-term Treasuries sold off sharply, sending the 2-year Treasury yield up 11 basis points to 4.34%. Meanwhile, major stock indices and risk assets like Bitcoin pulled back as profit-taking emerged: The SPX reached the weekly level of 7,763 and the confluence with the daily of 7,772 set enough resistance until 11:30AM, and the index fell straight to 7,700, a daily level posted yesterday in my daily SPX and ES=F levels.
During these days I have emphasized on patience, and the high risks of chasing price action when major gaps are being printed, last night I noted how NVDA rallied while other semiconductor darlings like AMD and MU fell in the red, today the daily level for NVDA (226.4) and for AMD (476.4) worked well as early warnings for a reversal since both stocks fell -4.6% and -2.3% respectively.
Probability of Rate Hike in September during FED Meeting:

Despite of the market reaction, the SPX fell marginally today, -0.25%, and QQQ dropped -0.65%. However, IWM lost -1.35%, and semiconductors (SMH) cratered -3.5%. Last Saturday in the Weekly Compass, I anticipated how critical this week was for semiconductors, and not only because of the NVDA earnings, but because some megacaps were in a make-or-break position. AMD, for example, lost its 20WMA for the first time since September 2025. I noted last week that the trendline was important, but price action suggested bearish continuation. Once again, price action and the conviction in the candle told the truth. The same case applied to SMH. For NVDA, the net weekly move was just +1.3%, printing a large weekly indecisive candle that contains an internal gap at 213.
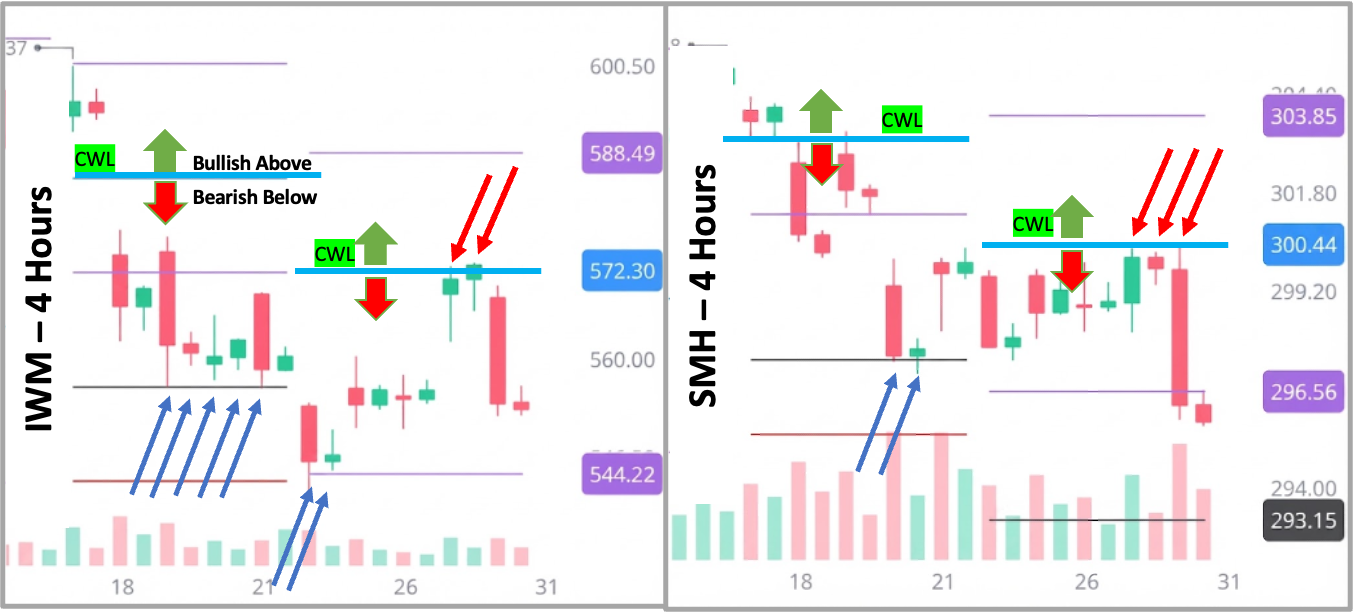
In choppy tapes like the one observed this week, the support and resistance levels modeled every week work as a reliable frame for upcoming price action and validate or invalidate directional theses coming from technical indicators. The examples below are for IWM and SMH using the 4-hour timeframe. Notice how the CWL modeled the Friday ahead of each week worked as a bullish-above and bearish-below reference, while the support lines below acted as targets and bouncing references. This week, the rally on Thursday failed to make it above the CWL for either IWM or SMH. The indecisive candles added probabilities for a bearish reversal, which proved to be the case today.
These levels are modeled every Friday for you, providing the information needed to assess risk and reward before the market opens on Monday. You don’t have to wait for the opening bell to decide your plan and which securities to trade; you have here the distances to essential levels and the setups suggesting whether they will act as support or resistance well in advance, so you make informed and serene decisions ahead of Monday morning. Always focused on our core watchlist:
Indices & Futures: SPX, NDX, DJI, IWM, ES=F, NQ=F
ETFs: SPY, QQQ, SMH, TLT, GLD, SLV, DIA, VXX
Major Stocks: AAPL, MSFT, GOOG, AMZN, NVDA, META, TSLA, SPCX, LLY, WMT, AVGO, COST, JPM, XOM, PLTR, NFLX, V, AMD
Crypto & Related: Bitcoin, Ethereum, ETHA, IBIT
Leveraged ETFs: TQQQ, SQQQ, UDOW, SDOW, UPRO, SPXS, URTY, SRTY
Upgrade to the paid plan, and unlock the levels for next week and view the complete report showing the distance of each security from its CWL for next week, allowing you to assess risk. With these levels, you can effectively anticipate targets.
What You Get as a Paid Subscriber
When you upgrade to the paid plan, you unlock three core publications each week, along with exclusive member benefits:
→Friday: Support and Resistance Levels for the week ahead.
→Saturday: The Weekly Compass, featuring an in-depth technical immersion.
→Wednesday: Market Intelligence and fundamental analyses.
In addition to our weekly publishing schedule, your membership includes three immediate advantages:
→Daily SPX & ES=F Levels: Receive daily levels assessing short-term momentum and potential reversal signals.
→ Instant Ebook Access: Download my two foundational technical analysis ebooks directly from the Market Intelligence Library. (click here)
→Customized Level Modeling: Every Sunday, submit your watchlist stocks in the paid subscriber chat. Their specific institutional levels are modeled for the week ahead and published directly to the site.
All content is available at SmartReversals.com.
Upgrade here:
Setups Recap:
Last weekend, using these levels, a bearish reversal was anticipated for XOM, triggered if 164 was lost, the price fell until finding support today at 155 for a -5% move, both levels were modeled last Friday ahead of this week.
The setups blueprint presented bullish setups for NFLX targeting $82 for a +3% move, same for PLTR with a 185 as target for a +3% move, for V the bullish target was 380 for a +2.6% move. The setups include bearish moves for traders who manage out options, leveraged ETFs, or simply shorting: AMD was posted as bearish with 450 as target for a -4.9% move completed on Monday, SMH targeting $544 for a -2.9% move. All these levels were modeled last Friday for this week. Unlock the levels for the week ahead considering all the watchlist mentioned.
Let’s begin.
WEEKLY LEVELS
The highlighted column on the right shows the percentage that each security must gain in order to set bullish momentum references. I have seen in social media a lot of relief after today’s muted move in the SPX, and yes, see in green the SPX, but with very small cushion above the Central Weekly Level for next week.
Small Caps (IWM), Semiconductors (SMH), individual names like TSLA, XOM, and LLY are part of the ones that must jump in te proportion highlighted to validate any potential bounce, but most interestingly, NVDA closed the week in bearish territory when considering the levels; anyway, price action didn’t show conviction as mentioned already.
NFLX continues constructive, GLD and IBIT are in a normal consolidation, AAPL looks promising, while GOOG, META, and AMZN are validating my theses from last week: