Measuring Bubbles with Research and Technical Analysis
Key Aspects When Buying an Overheated Asset - Real Case Studies
In today’s financial landscape, the air is thick with debate: are we witnessing bubbles in Bitcoin, technology, and metals, or is this simply the new normal of price discovery? While pundits argue over valuations, the reality for the smart investor is that the binary choice between “bubble” or “growth” is often a distraction. Ultimately, successful trading isn’t about proving a thesis right or wrong; it is about navigating the volatility with unwavering discipline, sharp market intelligence, and rigorous risk management to protect capital regardless of the narrative.
Today I have a special post, I’ve collaborated with Alpha in Academia, a research-driven newsletter that digs through academic finance and economics papers and turns them into clear, testable trading insights. He focuses on bridging the gap between journals and actual portfolios, stress-testing popular strategies, and showing where the data really supports an edge. In this piece, we combine his surveys of the academic research on bubbles with my technical approach that illustrate how price action and technical indicators signal momentum and reversal signals that every investor and trader should have in consideration for recognizing and trading overheated assets.
A Short Field Guide to Bubbles
There is something deeply comforting about bubbles. They are the most human part of finance. Every generation promises that this time the future is different, and every generation discovers that the future is only sort of different. The Great Depression had the 1920s stock boom, Japan had its 1980s everything boom, Silicon Valley had the dot-coms, and we have had our share of crypto coins, meme stocks, and electric vehicles. If you want to stretch the definition, you could include the shale boom of the 2010s, where cheap credit and heroic PowerPoint decks created an industry that produced far more oil (and far less profit) than anyone intended.
Economists like to measure things, even irrational exuberance. The last hundred years of bubbles all have the same basic ingredients: a big idea, cheap financing, a story that sounds rational enough to repeat at dinner, and a willingness to ignore that everyone else is telling the same story. What differs is how you measure the mania. The academic papers on bubbles (usually written after they pop) try to answer three questions: When is a price rise a bubble? How do you know before it bursts? And what, exactly, is so bad about one anyway?
How to Tell When You’re in a Bubble
Eugene Fama, who gave us the efficient-market hypothesis, thought bubbles were mostly myths. A price that rises a lot might fall later, or it might just reflect new information. To prove this, Greenwood, Shleifer, and You looked at every U.S. industry that doubled in price within two years since 1928. The authors found that forty events fit this criteria. A big price rise alone does not guarantee doom, and some industries keep running. However, the probability of a 40 percent crash within two years increases sharply once the run-up crosses about 150 percent. The point is not that bubbles are predictable in magnitude; it is that they leave statistical fingerprints. When volatility rises, new equity issuance floods in, and the youngest firms are the biggest winners, the crash odds start to look less like chance and more like physics.
The Fama challenge therefore isn’t that markets never err. It’s that the line between optimism and mania is hard to draw while you are standing on it (or else spotting bubbles would be easy!). The researchers’ subtle point is that “bubbles” are often clusters of normal incentives (cheap capital, momentum, and storytelling) that happen to coincide.
The Rational Bubble
Conversely, Pastor and Veronesi make the bold claim that bubbles might be rational. Their model for discovering bubbles starts with a new technology (railroads in the 1800s, the Internet in the 1990s, maybe AI today) whose future productivity is uncertain. At first, the risk is idiosyncratic; a failed experiment hurts a few investors, not the economy, and positive news pushes up prices. As adoption spreads, that risk becomes systematic; now the entire economy’s fortunes depend on whether the technology delivers. The discount rate rises with that new systemic exposure, pulling prices down. Early investors see only good news and buy, later investors realize they are buying a claim on the entire business cycle and hesitate.
This explains why investors living through technological revolutions always think the current one is real (and why they are partly right). The railroad boom built track, the Internet boom built infrastructure, and even the 2020s AI mania is building data centers. The model says prices rise too fast because knowledge diffuses too slowly. In practice, that diffusion leaves behind capital and infrastructure that persists long after valuations fade.
Momentum and the Crowd
If you want to know how a bubble feels from inside, Moskowitz and Grinblatt provide a map. They show that momentum (the tendency for winners to keep winning) is not mainly about individual stocks but about industries. When an industry starts outperforming, its components tend to move together, creating a reinforcing loop. Traders call this “chasing beta”: investors buy what is going up because everyone else is buying it.
This explains why bubbles have themes. In 1999 it was “anything dot-com.” In 2020 it was “anything electric.” The basket rallies first, the stories about paradigm shifts follow, and eventually the basket’s correlation to the broader market rises as it becomes systemic. By the time major news outlets name the theme, you are no longer buying a stock, but rather the narrative.
The Electric Vehicle Euphoria
That narrative reached its most vivid form in the electric-vehicle boom of 2020 to 2021. Arnott, Cornell, and Wu called it a “big market delusion.” Investors were so excited about the shift to EVs that they priced every manufacturer as if all could dominate. Specialist EV firms’ market value rose more than sixfold to roughly one trillion dollars (about equal to the entire traditional auto industry) while aggregate revenues fell. Tesla alone reached three-quarters of a trillion in value, but instead of depressing competitors’ valuations, it inflated them.
Speaking of euphoria, dear subscriber, you may recall NIO, the Chinese electric vehicle company that experienced a massive boom in late 2020. If you were a market participant back then, I congratulate you on your consistency. Many investors quit the market during a bear cycle because they often enter during periods of euphoria, when prices have risen too high, too fast, without solid fundamental support. This extreme price action stretches technical indicators that algorithms, institutions, and experienced traders utilize not only to sell, but also to initiate strong bearish pressure through short selling. Buying into such euphoria carries a high cost when an individual assumes prices can only rise. When the market inevitably pulls back and they lose capital, many investors quit.
Let’s study some charts and technical indicators to assess when a stock, commodity, index, cryptocurrency or any other asset is getting overheated.
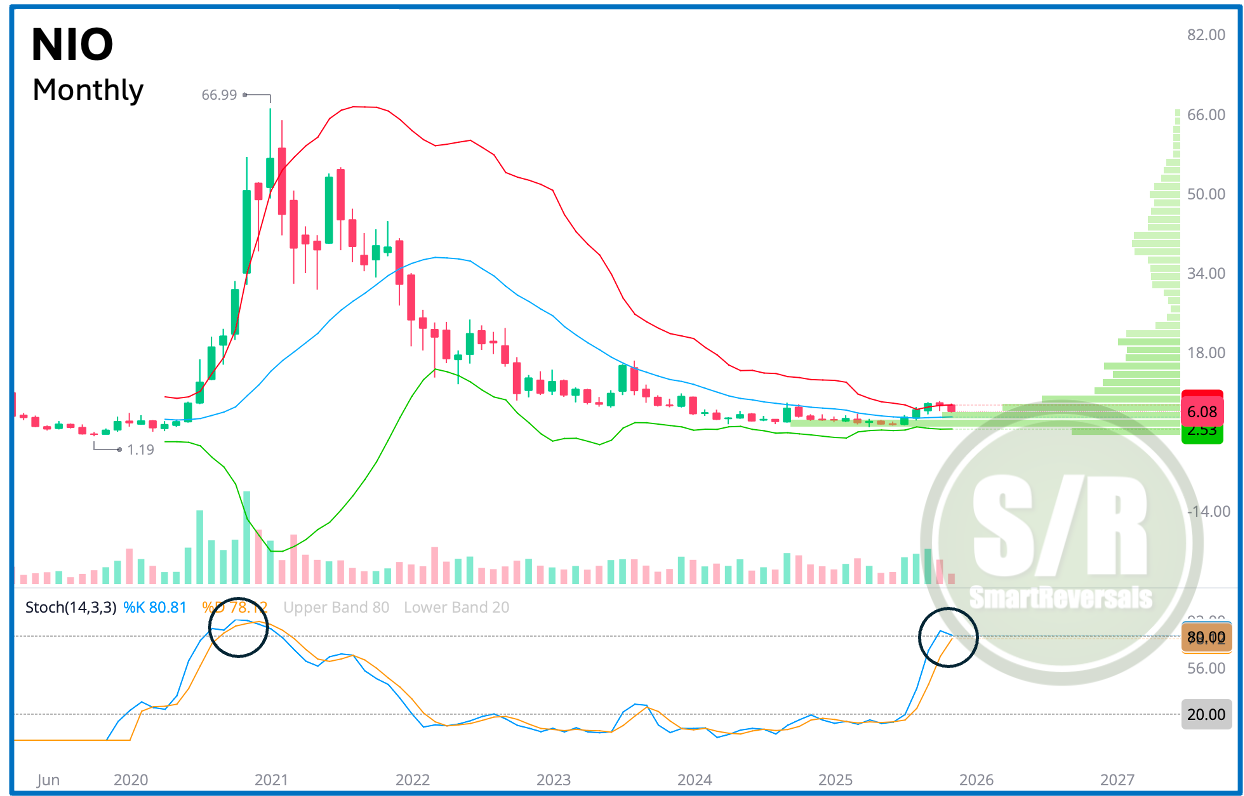
Let’s use NIO as a case study. The stock underwent a parabolic ascent, jumping 2,660% from $2.20 (April 2020) to $66.00 (January 2021) in just ten months. As the chart below shows, the Bollinger Bands (which highlight overbought (above the upper band) and oversold (below the lower band) conditions) were consistently breached. The price action on the monthly chart was completely above the upper band for several months, signaling an extremely rare overextension. This type of move typically results in a sharp snapback to the Bollinger range. Because the stock’s valuation lacked fundamental backing, the price collapsed just as the Stochastic Oscillator (a key timing indicator) printed a bearish crossover from the highly overbought zone (above 80).
The stock crashed -52% in just two months after peaking. For those who believe ‘buy and hold’ is universally effective, note that while it may apply to indices (though still painful during bear markets), it can be extremely expensive for individual stocks. After five years, this stock has lost $-90\%$ of its value, and the highlighted Stochastic indicator is again printing a bearish crossover, suggesting further downside is imminent.
The key takeaway here is to be mindful of technical indicators in longer timeframes (like the monthly timeframe) to assess how overextended the price action can be.
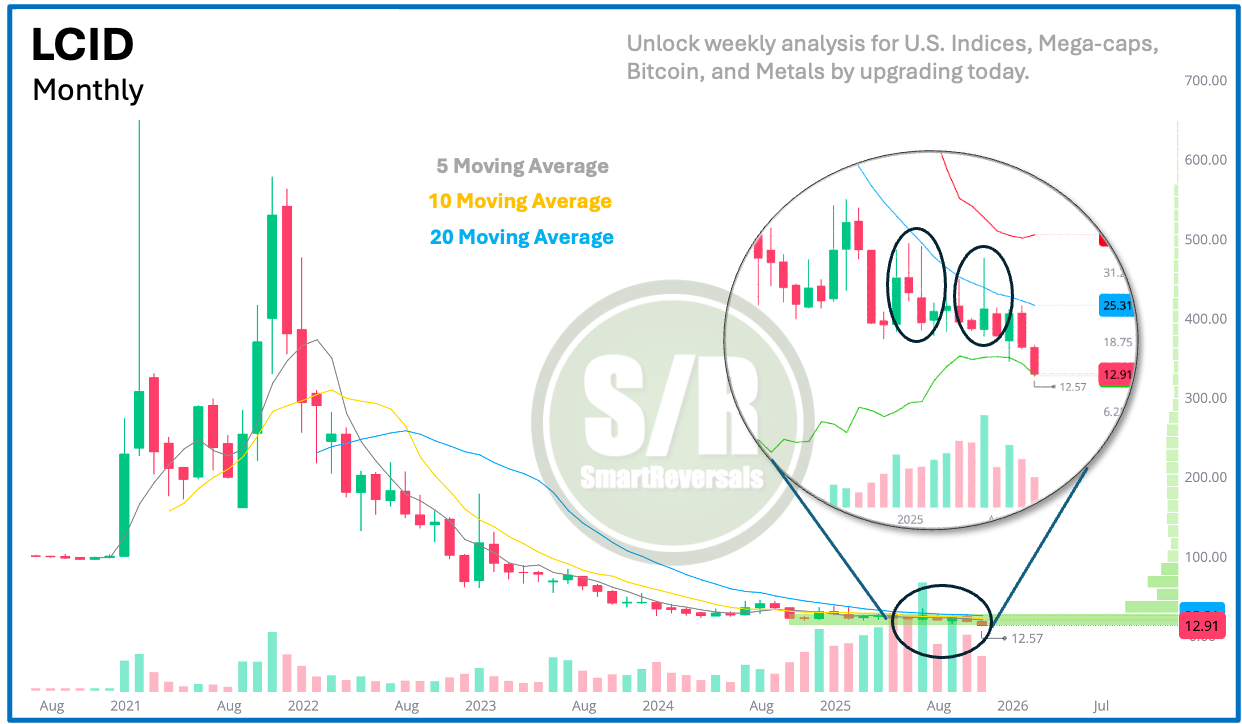
LUCID offers yet another case study in EV stock euphoria. The stock embarked on a wild ride, first spiking 571% in five months, followed by a dramatic 75% crash over the next eight months. After a brief, powerful 261% rally, the price has failed to sustain any momentum and has trended relentlessly lower ever since. The stock now trades below its initial public offering price (IPO). Recent price action confirms this weakness, showing a clear rejection from the 20-month Moving Average as the downtrend accelerates.
The horizontal green line is the Volume Profile Indicator, that shows price levels with high relevance, currently the stock is trying to breach the current shelf.
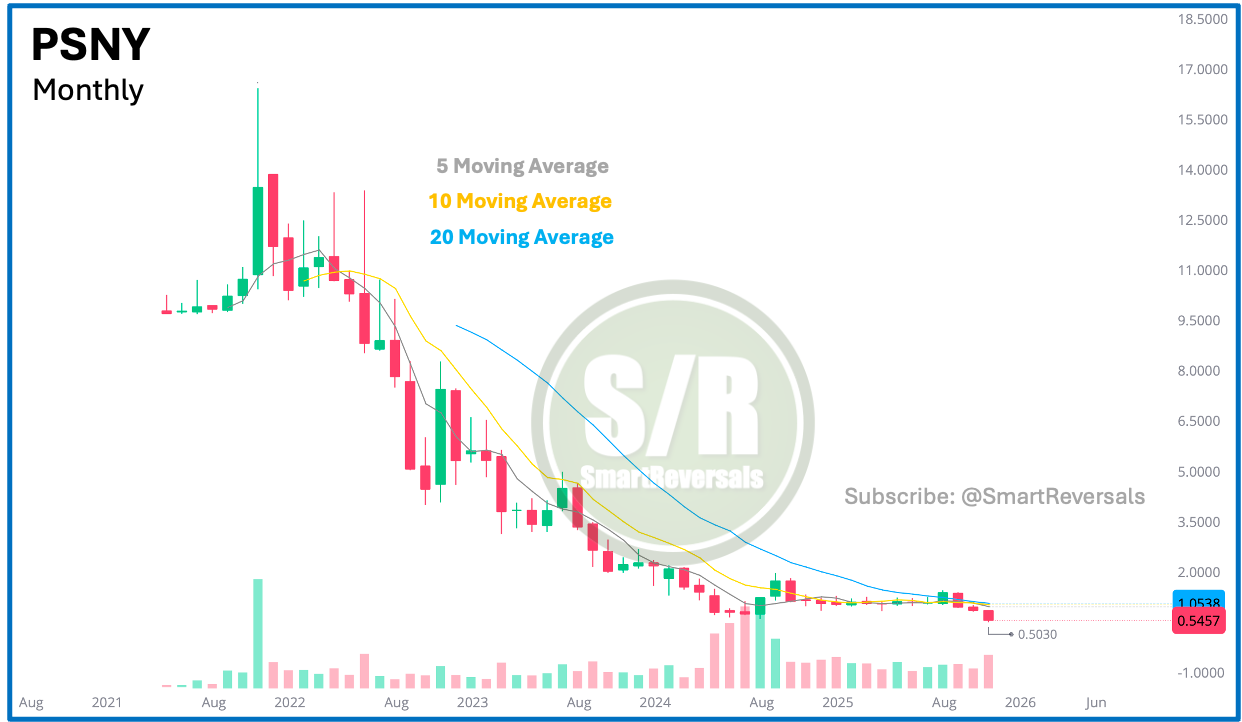
The electric vehicle euphoria was indeed a global phenomenon. After studying a Chinese and an American example, let’s conclude with a European one: Polestar Automotive Holding PSNY. Adding moving averages to the chart immediately reveals the persistent downtrend. Crucially, the 20-month Moving Average has consistently acted as resistance, and the price is currently showing renewed signs of continuation lower.
Are the charts for those three companies suggesting a bounce is near? Not necessarily, and even with short lived rallies, these securities are still pointing south.
Alternative Energy in the 2000s
The EV episode was not the first green energy frenzy. Between 2005 and 2008, alternative-energy stocks in solar, wind, and biofuels surged and then collapsed. Oil prices and subsidies explained some of it, but not the speed or scale. Investors poured money into “clean tech” funds, convinced that rising crude prices would guarantee demand. The underlying idea was true: energy transitions happen. However, while optimism drove the early cash-flows, policy uncertainty and higher discount rates delivered the decline.
Still, that bubble built factories, trained engineers, and advanced technology that became commercially viable years later. It was an expensive way to learn, but it worked.
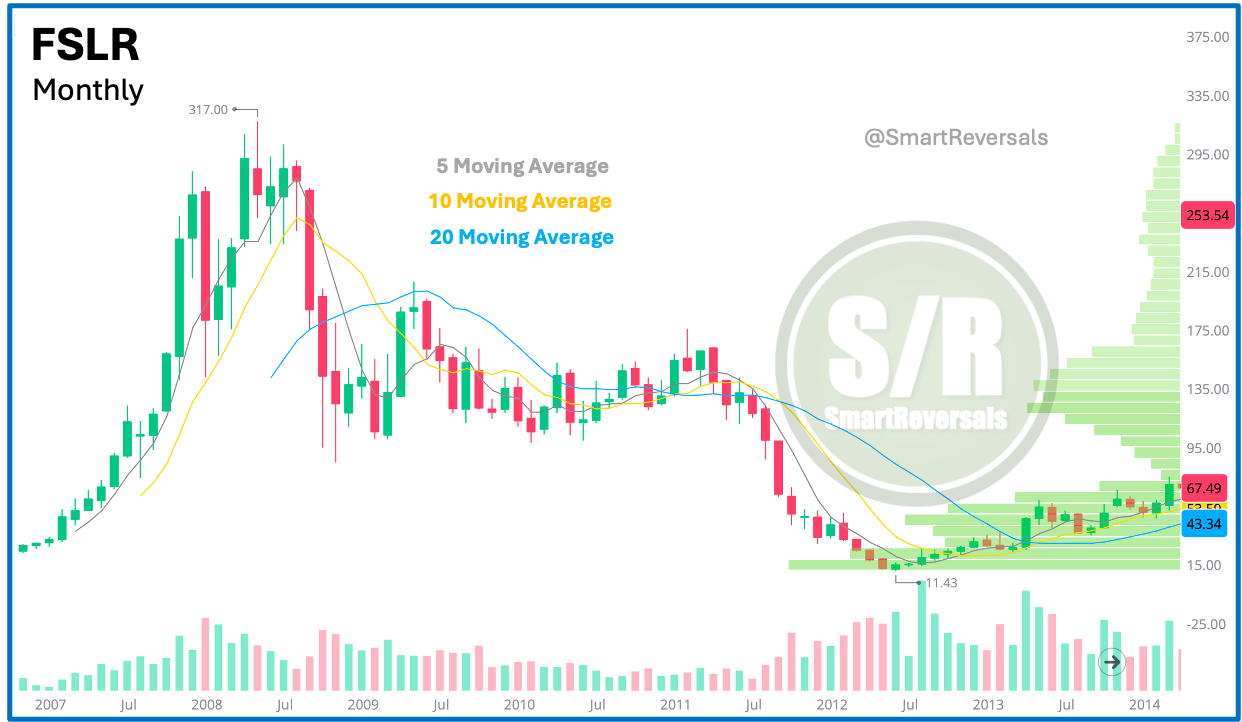
First Solar (FSLR) is a name frequently traded today. The stock is currently attempting to form a bullish Cup-and-Handle pattern which, following a pullback (the handle), could target $377. The price must successfully surpass $281. However, let’s analyze the pullback that followed its 2008 peak of $317, which was set by an indecisive monthly candle. When FSLR lost the 5-month Moving Average (a major warning sign for any bullish security), the stock plummeted -73% in seven months, a decline accelerated by the Global Financial Crisis. Critically, while the S&P 500 bounced in March 2009, FSLR continued to fall, resulting in a total selloff of -96% from its all-time high. When you buy a specific asset that has been rallying in a parabolic fashion you must do three things:
Assess technical indicators checking overbought conditions
Check fundamentals, is the PE ratio extremely high? Is the company profitable, is the revenue growing?
If you decide to buy, you must set a price level where if breached you cut your position, using Support and Resistance levels.
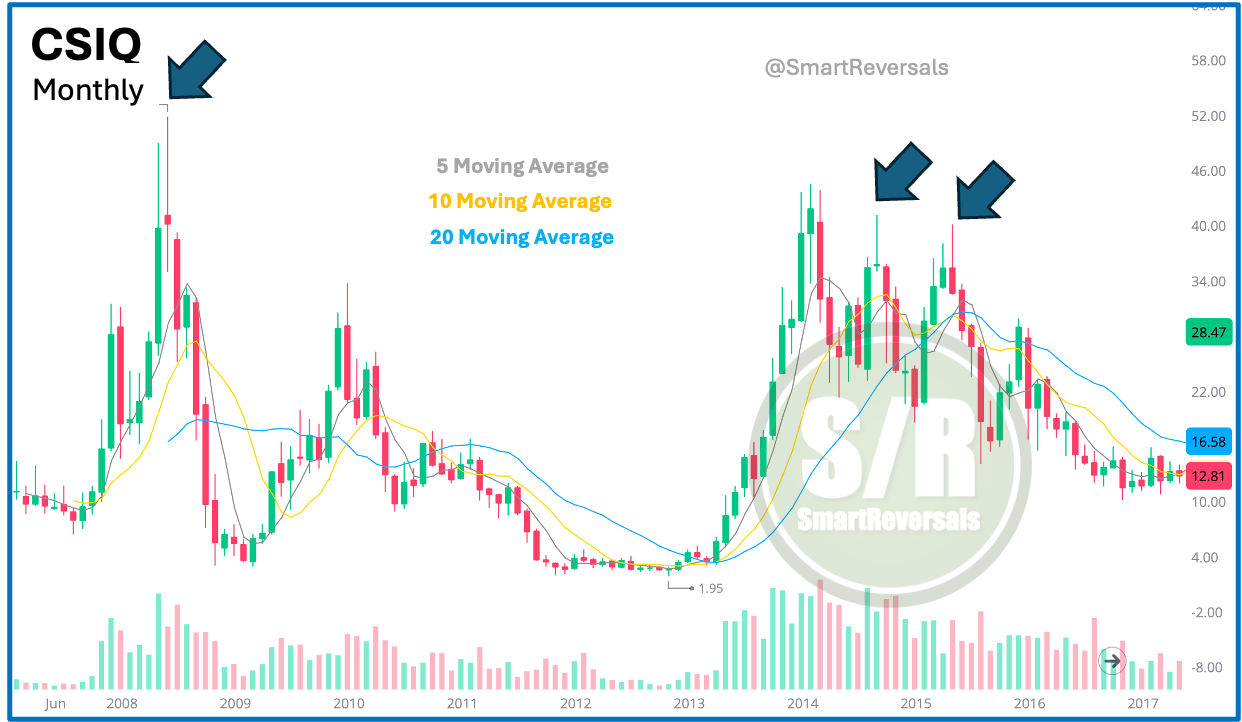
Canadian Solar (CSIQ) printed indecisive price action, forming a ‘shooting star’ candle that reveals how an intra month rally completely faded. On monthly timeframes, this formation is a major signal that demands attention. (For a quick homework assignment, check the October 2025 monthly candles for MSFT and Bitcoin to understand what is currently unfolding in November).
The collapse from $55 to $4 is a painful reminder of the risks involved in chasing euphoria. It validates the significance of the shooting star pattern mentioned above, as well as the critical role of moving averages as lines of defense. When one level is breached, the door opens to the next, as CSIQ illustrated in 2008 by rapidly surrendering the 5, 10, and 20 month averages. As highlighted, this exact pattern repeated in 2014 and 2015.
The Green Stock Market Bubble
By 2020, the story returned. Lehnert’s “Green Stock Market Bubble” argues that the parabolic rise in renewable-energy shares during 2020 and 2021 mirrored the dot-com playbook almost exactly. A recursive bubble-detection algorithm on the S&P 500 showed an “explosive” movement beginning mid-2021, but a green-energy index started exploding a year earlier. The speculative fever started with wind and solar names and then infected the broader market.
What makes this bubble interesting is that it might have been useful. Low interest rates and investor enthusiasm gave green companies access to cheap equity capital, which financed rapid capacity expansion. This is not so different from the Internet’s fiber build-out: valuations later collapsed, but the infrastructure remained. Lehnert calls it a “good bubble.” It overpaid investors to accelerate the energy transition.
You could say the same of shale in the 2010s. The U.S. financed an oil revolution on junk-bond money. Investors lost fortunes, but consumers gained cheap energy and geopolitical leverage. Markets may destroy capital, but they often leave tangible assets behind.
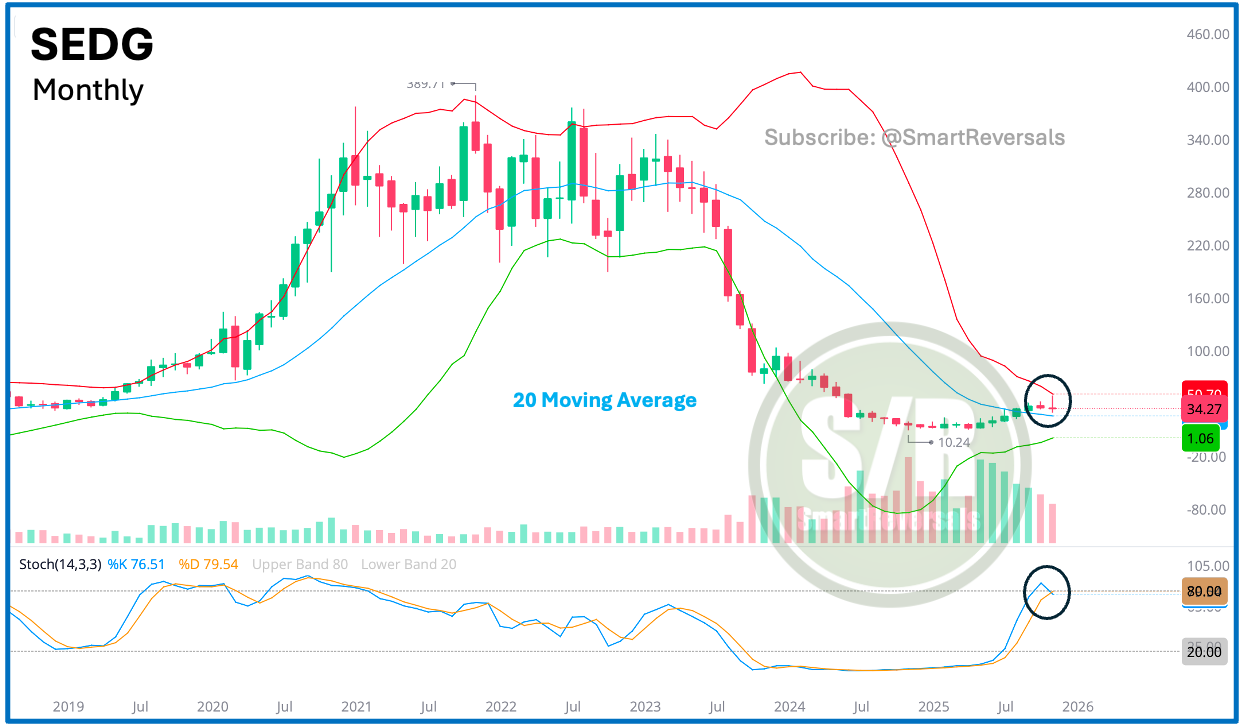
SolarEdge (SEDG): We see a massive rally from $83 to $332 in 2020, followed by a sharp selloff to $201 in May 2021. This drop wiped out more than half of the gains, once again trapping euphoria chasers who bought after a 400% run, believing the stock could only go up.
In this case, Bollinger Bands are essential for assessing overbought conditions, specifically when the candle exceeds the upper band as it did in 2020. However, technicals often don’t matter until they suddenly do; a three-year period of choppy range trading followed. Eventually, the price crashed, breaching the lower Bollinger Band. While it attempted to find support and bounce recently, the upper band is now acting as firm resistance in November 2025. Additionally, the Stochastic oscillator is curling down from the overbought zone, suggesting that a decline is imminent.
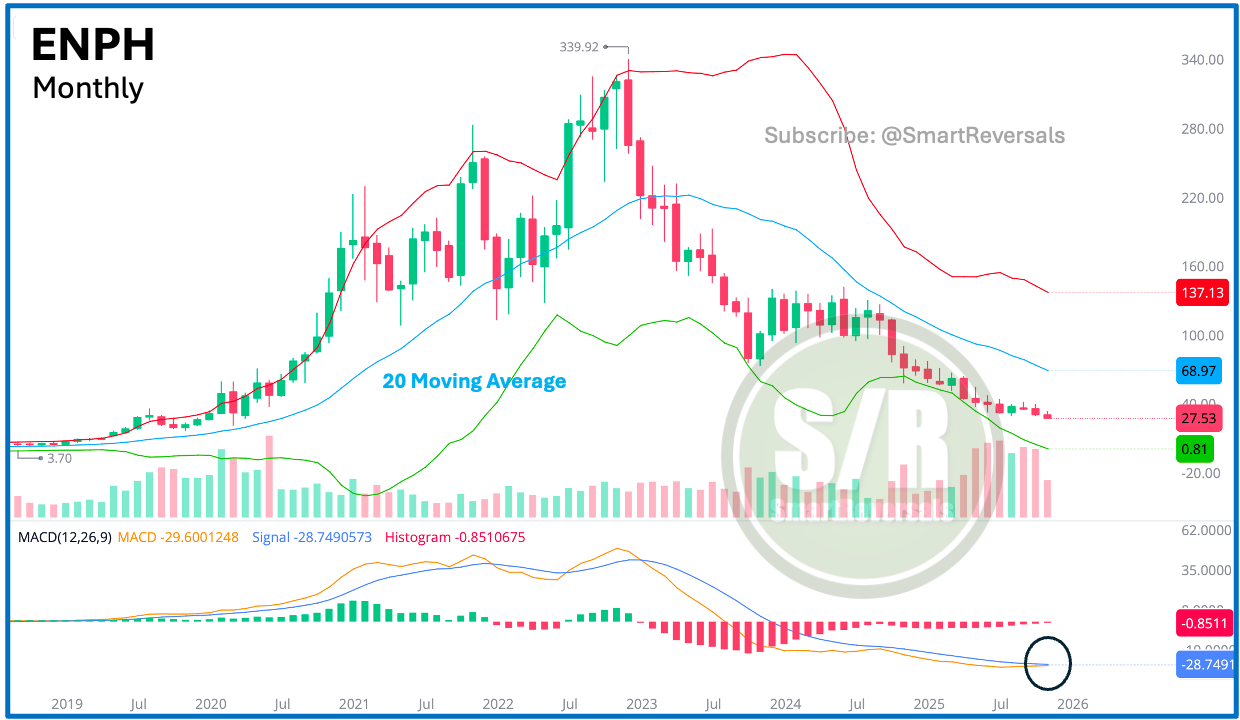
Enphase Energy (ENPH) was another stock that rallied in 2020. The volatility continued for a couple of years, offering excellent swing trading opportunities based on monthly candlestick patterns. When broken down to a weekly timeframe, these moves allowed for precise timing of buys and sells using technical indicators.
ENPH has not yet found a bottom in 2025. Price action continues to drift lower, and the lower Bollinger Band is far from acting as support. It is worth noting that the MACD oscillator is curling up; a bullish crossover on the monthly timeframe would be a major signal to watch, potentially indicating a price spike for bulls.
Why Bubbles Happen and Why They Help
Bubbles are coordination problems dressed as optimism. Everyone knows valuations are stretched, but no one wants to miss the run. Money managers do not want to miss out on the run, policy makers often get fed a narrative, bankers like underwriting fees, and corporate treasurers love cheap equity. The cycle feeds itself until either money tightens or reality catches up.
From a welfare perspective, bubbles are inefficient but creative. They shift the cost of experimentation from governments to investors. The Internet bubble built broadband. The housing bubble expanded homeownership and mortgage infrastructure. The green bubble is funding gigafactories. The clean-tech bubble of the 2000s failed commercially but succeeded technologically. Each wave burns capital but builds capacity.
After the Pop
When bubbles burst, the losses are obvious, but the infrastructure remains. Investors become more selective, risk premias reset, and the surviving firms often dominate the next cycle. Amazon was the punchline of the dot-com collapse and the blueprint of what followed. Tesla, despite its valuation extremes, may play the same role for electrification.
Economists still debate whether bubbles are predictable or even measurable in real time. The honest answer is that they are easier to recognize than to time. A surge in volatility, issuance, and industry correlation should make you cautious, but it will not tell you when to sell. For practitioners, the goal is not to avoid every bubble; it is to survive them, or better yet, to sell capital to them.
The Moral of the Story
Financial history is full of mistakes that built the future. Investors overpay for potential, markets overshoot, and engineers quietly spend the money building real things. Later generations call it a bubble. The word sounds like failure, but it often describes the messy process by which societies fund progress.
The next one (AI, quantum computing, whatever comes after) will look the same: an explosion of narratives, a flood of capital, and a later reckoning about who actually made money. The trick is not to avoid the excitement but to remember what part of it is permanent.
Bubbles pop, but the infrastructure usually stays. That is not efficient, but it is how the future gets financed. So the question may be, “Should we encourage bubbles?” I’ll leave that up to you to decide.
Technical analysis enables us to maximize the potential of market bubbles. There is inherently nothing wrong with riding these moves; the mistake lies in buying blindly without a clear technical understanding of how overbought the price action has become. This insight is essential for setting stop losses that protect traders and investors from severe declines when the trend eventually reverses.
What About Tesla?
Since we have discussed electric vehicles, energy, and bursting bubbles, we must address TSLA. This is a company that has thrived in the market, not without significant volatility, but certainly successful in achieving recent all-time highs.
While monthly timeframes (like those presented above) are excellent for long-term investors to gauge macro trends, I prefer the weekly timeframe for active trading and investing. This frequency allows us to assess price action before major drawdowns occur and before (or during) rallies begin, enabling investors to fully benefit from the move.
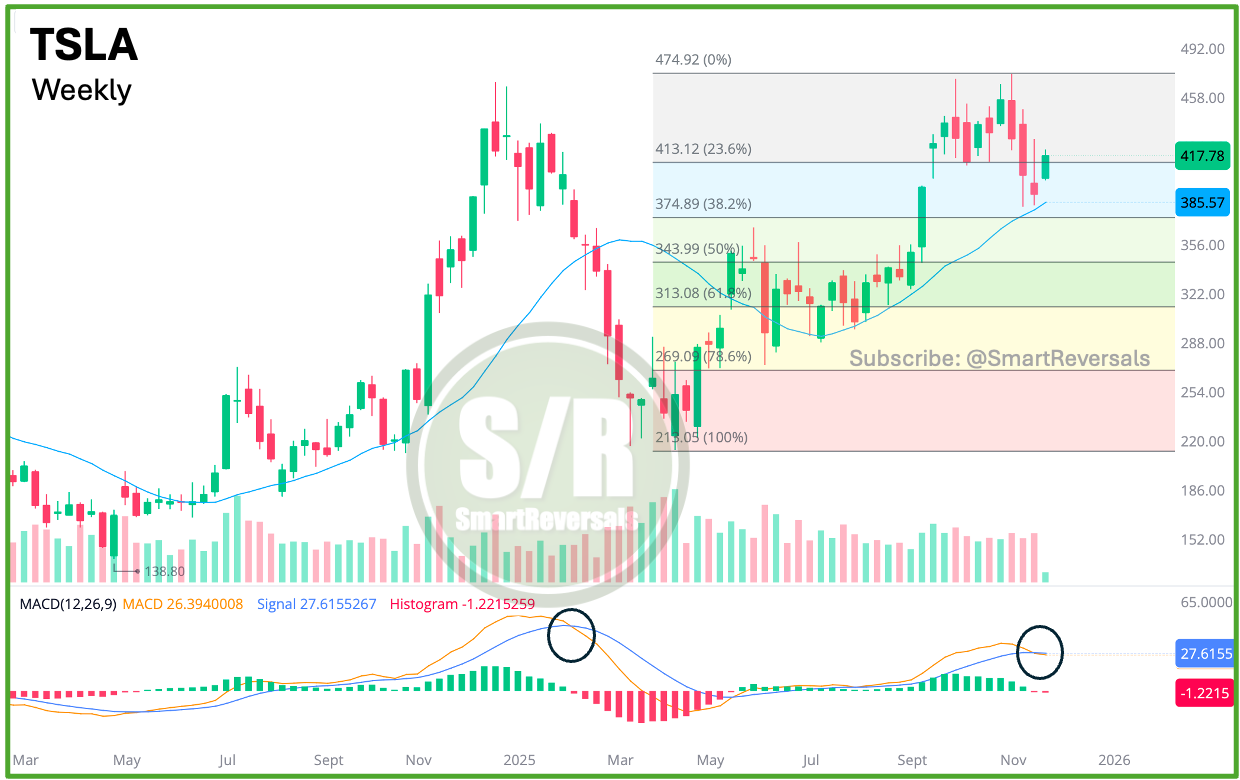
Let’s analyze TSLA understanding Fibonacci Retracements: They are a technical tool used to identify strategic levels of support and resistance based on mathematical ratios found throughout nature. In financial markets, these levels (most notably 23.6%, 38.2%, 50%, and 61.8%) help measure the depth of a correction within a larger trend. The core concept is that after a significant price move, the asset could “retrace” a predictable portion of that distance before resuming its original direction, providing traders with objective zones to anticipate reversals or enter trades.
For Tesla (TSLA), we see a textbook example of “confluence,” where the price found firm support exactly at the 38.2% Fibonacci zone, perfectly coinciding with the rising 20-weekly moving average. This structural defense suggested the bounce just observed; however, the bulls need to deliver a decisive and powerful rally to negate the looming threat in the subchart. The MACD is currently initiating a bearish crossover, a major momentum warning that mirrors the significant trend reversal witnessed in February 2025 (highlighted in the chart). Investors must watch closely: while the 20 weekly average is currently acting as a floor, a sustained breach of this line would confirm the bearish crossover and signal a deeper continuation to the downside.
As a special bonus for those who read the full publication, here are this week’s critical coordinates: The central weekly level sits at $401.3; momentum remains bullish as long as the price holds above this marker. The first bullish target of $418.8 (shared last Friday) was hit during the first half of the session, though the stock closed right at that level with precision (remember that number was modeled ahead of the actual price action). The bullish trend remains active until proven otherwise. If momentum continues given the recent oversold conditions, $428 is the next destination for this bounce, and then $446.
Conclusion
Whether you already use technical analysis and support/resistance levels or are just interested in learning them, upgrade your subscription to SmartReversals.com. This publication tracks the watchlist below with three updates per week, providing you with a comprehensive market overview and actionable opportunities to rotate capital among different stocks.
Indices & Futures: SPX, NDX, DJI, IWM, ES=F, NQ=F
ETFs: SPY, QQQ, SMH, TLT, GLD, SLV, DIA, SH, PSQ
Major Stocks: AAPL, MSFT, GOOG, AMZN, NVDA, META, TSLA, BRK.B, LLY, WMT, AVGO, COST, JPM, PLTR, NFLX
Crypto & Related: Bitcoin, ETH, IBIT, MSTR
Leveraged ETFs: TQQQ, SQQQ, UDOW, SDOW, UPRO, SPXS, URTY, SRTY
Alpha in Academia shows you how rigorous academic finance research turns into real-world trades; subscribe to get weekly breakdowns of new papers, tested strategies, and practical tools on macro, rates, and systematic investing that you can actually apply in your own portfolio.
Let’s get 70 likes and 30 reposts for more publications for everyone ;)
Have a good day everyone.
SmartReversals and Alpha in Academia
The content provided on SmartReveals.com is for educational and informational purposes only. All analyses, research, commentary, and other materials are intended to help users understand financial markets, investment concepts, and company fundamentals. This content does not constitute investment or any type of advice. The support and resistance levels are modeled references to manage risk and anticipate potential reversals, each investor must assess their own risk tolerance to set stops.
My only communication channel with you is via email, and the Substack chat, I don’t use Telegram, WhatsApp, Discord, or any other communication method.


