

Every Friday, I post modeled levels for the week ahead across more than 40 securities. This week’s Support and Resistance framework anticipated bullish conditions for the SPX once price reclaimed 7,668, setting 7,725 as the first upside target. That target was reached today, where afternoon price action stalled into indecision. As subscribers know, indecision right below resistance demands caution for longs, just as stalling above support warns shorts, particularly around weekly levels.
Because weekly levels can span a wide range (not to mention the monthly levels also updated here), I provide daily levels to map early reversal warnings or validations and intermediate support and resistance levels.
Mirroring the Central Weekly Level (CWL), I share a Central Daily Level (CDL) every day along with its surrounding support and resistance levels. For today, 7,672.9 served as the anticipated CDL, with 7,706 as intermediate resistance and 7,735 as extended resistance. Price reversed today right at 7,735 twice (at 12:45 PM and 3:45 PM), ultimately settling below the weekly level of 7,725.
Institutional algorithms react around these price zones. Having them plotted ahead of the session gives you a real edge, showing you where to prepare for potential reversals and where to watch for consolidation.
Tomorrow’s levels are detailed below, and they are essential for two reasons:
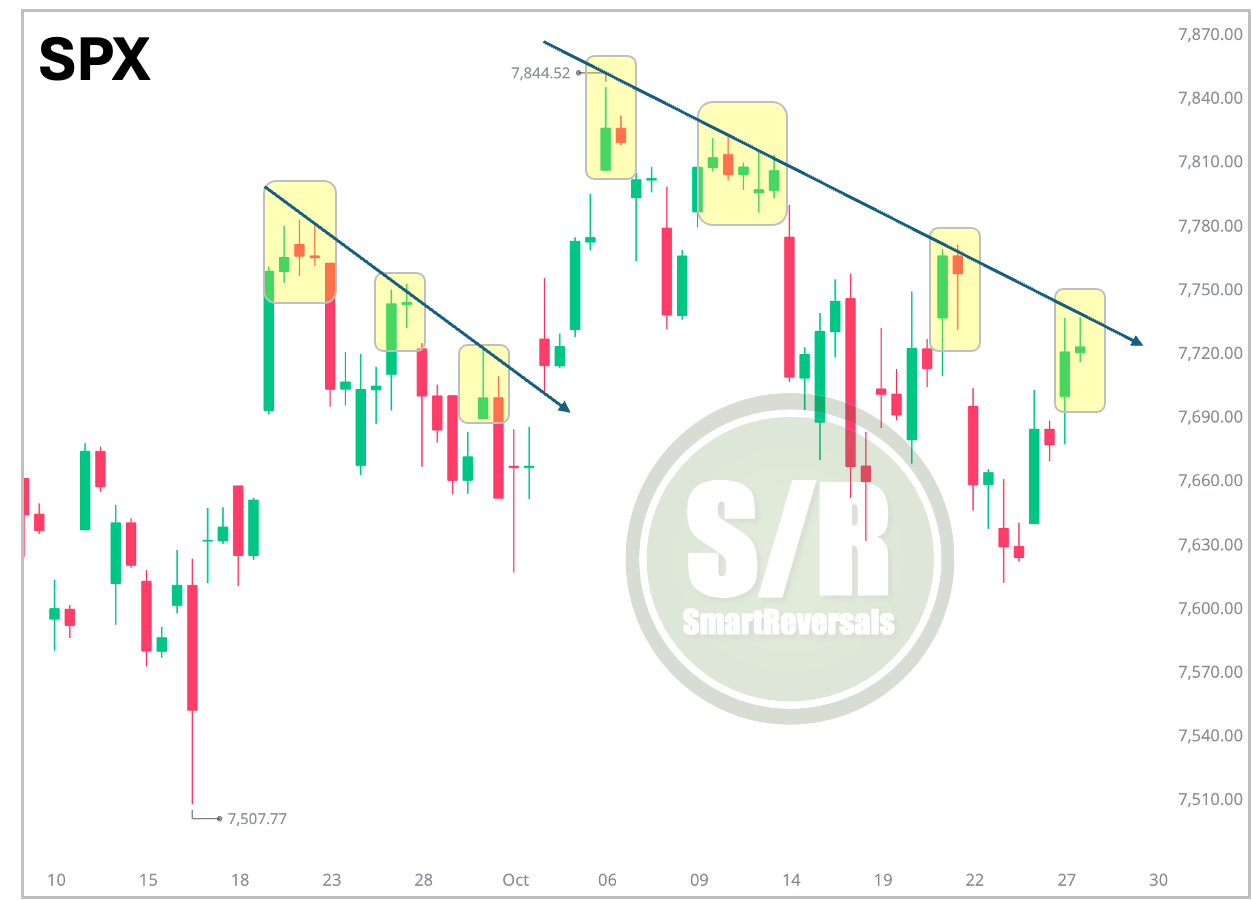
Price is testing a major confluence of resistance across daily levels, weekly levels, and the descending trendline highlighted below.
The Fed announces its interest rate decision tomorrow afternoon against a backdrop of sticky inflation.
Subscribe now to premium content and unlock this daily analysis, along with the weekend publications featuring key levels and setups for the week ahead. Subscribing also grants you full access to my educational library, including two eBooks on technical analysis (Essentials and Advanced), plus the ability to submit your favorite stocks every weekend to have their support and resistance levels modeled for the week ahead.
The Support and Resistance levels for this week are here with educational charts using SPX and QQQ:

And my educational library is here with the two downloadable books

Today’s Agenda
Two Pathways Analyzed on Saturday
Daily plan for SPX, ES=F.
Daily and Weekly Levels Combined for SPX, ES=F, MSFT, GOOG, AMZN, V, NVDA, AMD, LLY.
Watchlist Tracker
Let’s begin.
SPX: Two Pathways Analyzed on Saturday
We studied two scenarios for the index, here are the levels and the chart posted on Saturday with both lines aiming at the same objective: