
Fundamental Analysis: GOOG - META
Monthly Charts for SPX and IWM for everyone - And a New Installment of Fundamental Analysis, a Comprehensive Approach to Trading and Investing


Correction coming or not, these two companies show solid financials and competitive advantages that are worth considering for the short and long term.
Before diving into a comprehensive summary of the various business pillars that META and GOOG have established and the opportunities they present for both companies, let's examine the most relevant monthly charts.
SPX
A month ago I anticipated to premium (paid) subscribers that the hanging man seen in August was not a top and that new all time highs were coming, well, that was proven true. The analogy used was the price action of October 2014, which is the first candle highlighted in the chart.
Price action moved up in September 2024 as expected and so far October started with weakness in price, as it happened back in December 2014.
The SP500 is showing exhaustion, and a giant bearish divergence with RSI which crossed above 70 in September, is something to watch carefully.
In addition the bearish crossover in the second oscillator has provided accurate warnings as highlighted with red circles, only one was invalidated in the last ten years.
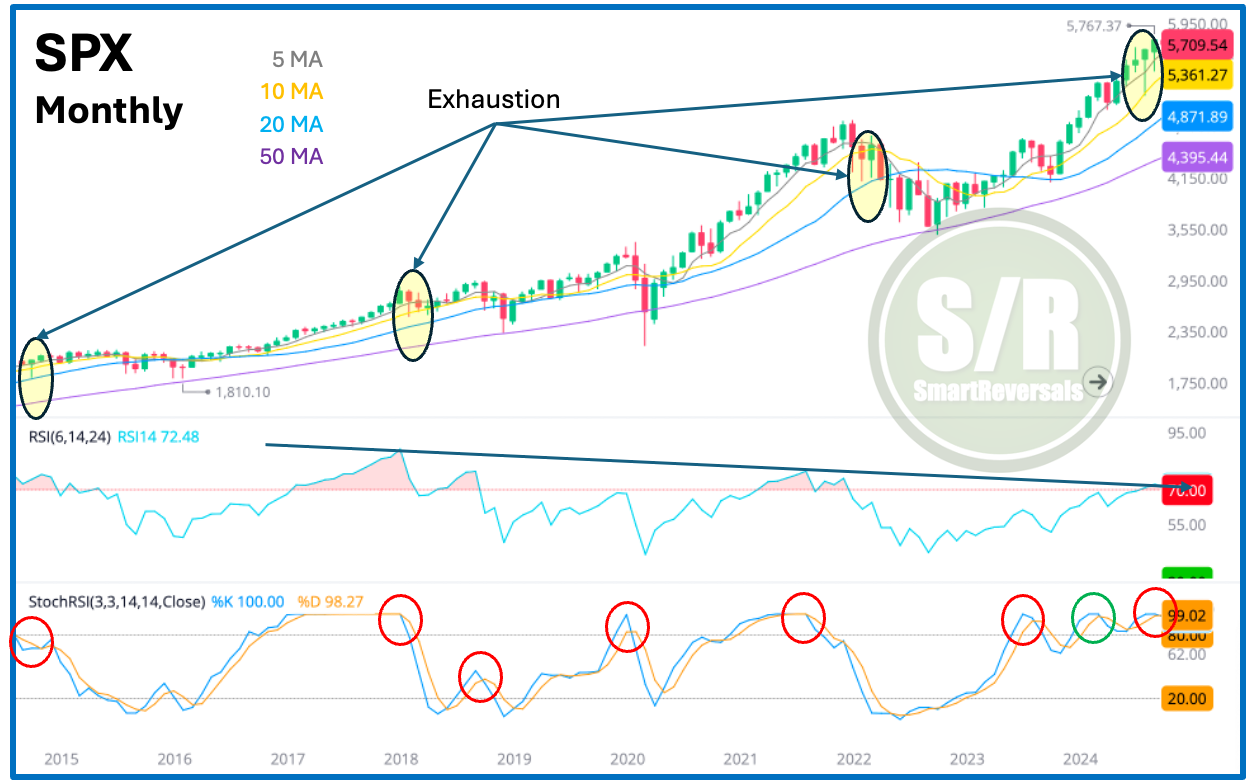
This pattern is similar to the monthly charts for NDX, DJI, AAPL, MSFT; which is quite worrisome. NVDA does not present clear direction in the monthly chart.
If the market set a top already or is close to it, an analysis of bear markets was presented last Saturday.
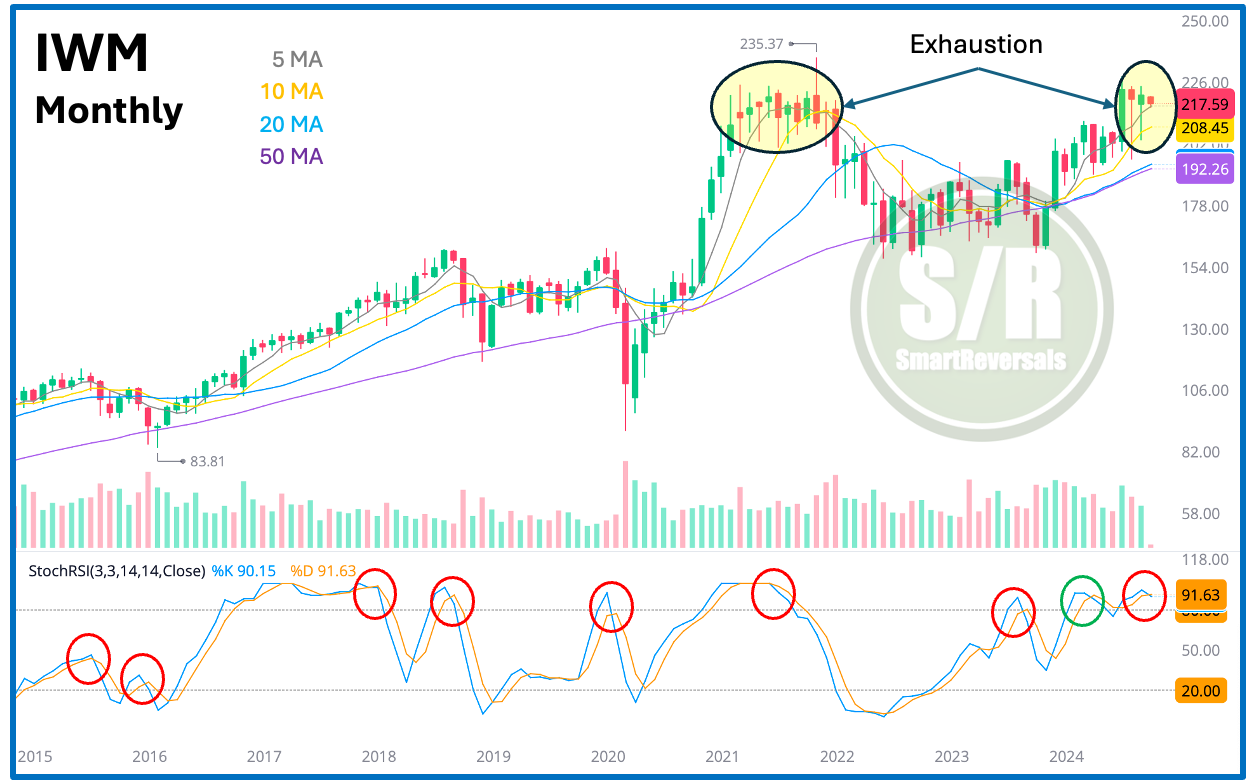
IWM
Another index showing exhaustion but with different price action is the Small Caps; see what happened in 2021, so far a base is in consolidation but history suggests the trend is weakening, and the oscillator shows a bearish crossover so far, bear in mind October just started.
The annual S/R levels to watch are charted every Saturday in the weekly compass, consider to upgrade your subscription, so you don’t have to wait until the end of the month to see if the monthly candle closed below the 5 Monthly Average.
Now let’s go to the main topic, a top is likely in the market, and this is the moment to start observing which companies are investment opportunities in any pullback, or maybe from now according to each person’s risk tolerance.
So far the following companies have been studied in this Wednesday’s edition: TSLA, NVDA, AMZN, COST, TGT, SHOP; and today META, and GOOG, as the Advertising giants.
Some of those companies are good examples of non investable ones, and some others are very interesting, I provide a point of view at the end of each fundamental context.
The educational content about fundamental indicators used actual figures for all the seven tech mega-caps, get access here:

Access to the other companies’ analyses here:


Let’s begin:
