
Monthly Gravestone: Is the Dow Jones Topping Out?
Why is this signal relevant? - Support and Resistance Levels for Futures, Indices, ETFs, Megacaps, Crypto, and Metals.

U.S. equities concluded a volatile week and month on a downbeat note, with major indices finishing in the red on Friday. The S&P 500 fell 0.9% in February to close at 6,878.9, slipping below its 50-day moving average. The Nasdaq 100 shed 2.3% for the month, while the Dow Jones Industrial Average finished flat, wiping out its previous rally. Small-caps followed suit, as the Russell 2000 erased its monthly gains to close unchanged. Sentiment was weighed down by hotter-than-expected PPI data, which pushed out Fed rate-cut expectations and reignited fears over AI infrastructure disruption.
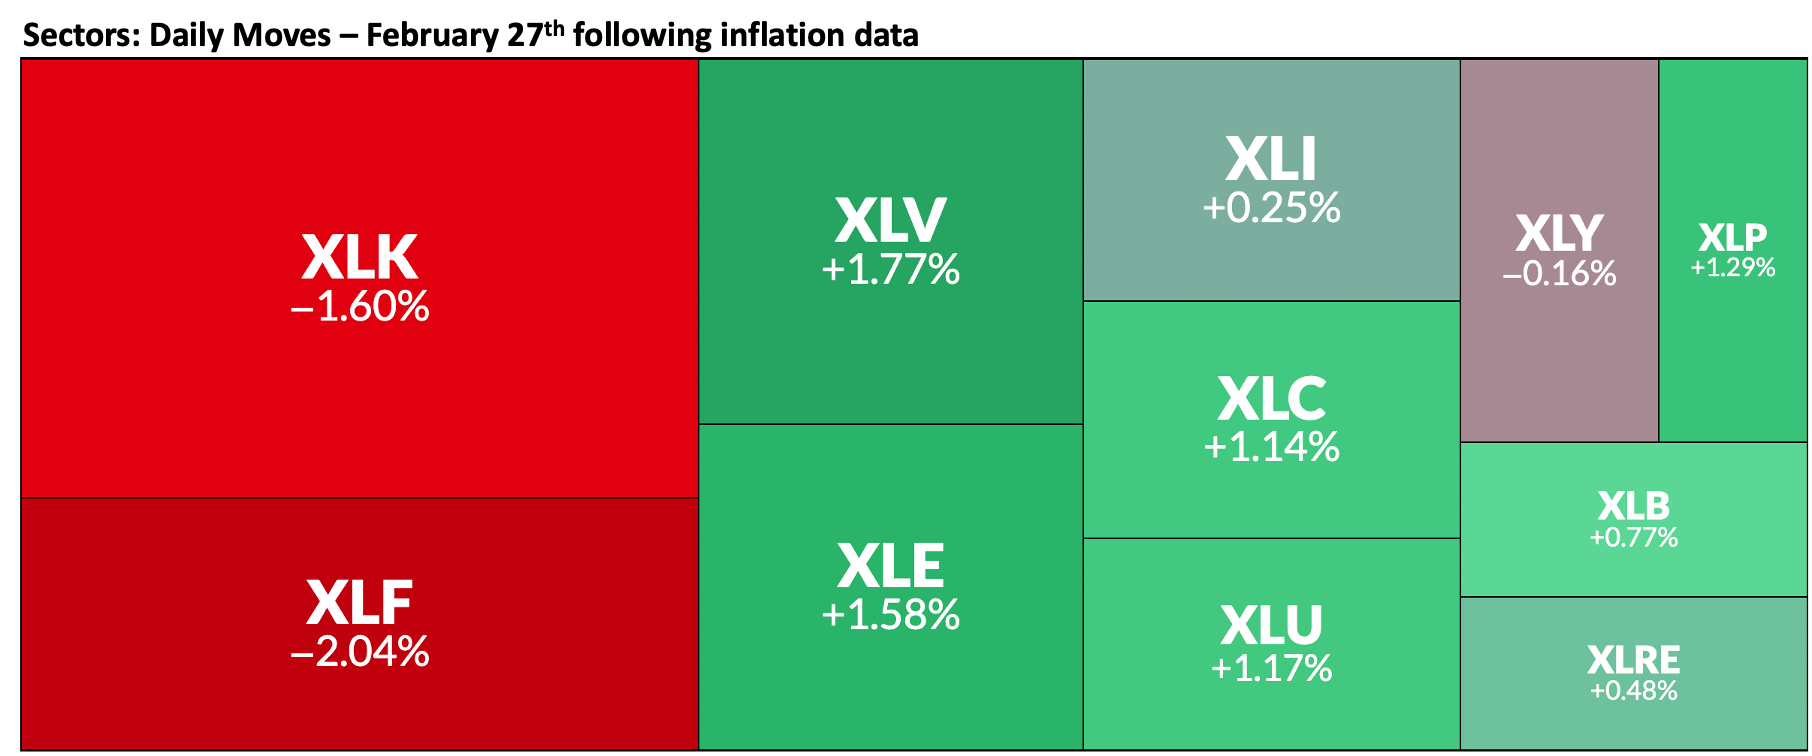
Technology and financial stocks bore the brunt of the selling today. The information technology sector dropped 1.6%, dragged lower by persistent weakness in software and a 4.2% decline in Nvidia. The chipmaker, which had already slid over 5.5% on Thursday despite strong earnings. The financials sector fell 2.0%, led by a 7.4% drop in Goldman Sachs, as the hotter inflation reading undercut the bull case for capital markets activity. Concerns over AI automation added to the pressure after Block announced a 40% workforce reduction, compounding weakness in asset managers already rattled by the collapse of U.K. mortgage firm Market Financial Solutions.
Despite the selling in tech and financials, the market showed notable rotation into defensive and energy sectors again. Health care, consumer staples, and utilities posted gains of 1.8%, 1.3%, and 1.2% respectively. The energy sector surged 1.6% as crude oil futures climbed 2.8% to $67.06 per barrel, though rising fuel costs punished airline stocks like United Airlines and Delta Air Lines. In the bond market, Treasuries rallied and sent yields to their lowest levels of the year. The 10-year note yield settled down 13 basis points for the week at 3.96%.
Support and Resistance Levels
Over the past few weeks, I’ve highlighted the importance of the Central Monthly Level (CML). For long-term investors, the CML acts as a primary trigger: a recovery of this level signals a “buy,” while losing it suggests a “sell” or defensive posture.
For high-frequency traders, the CML serves as a volatility filter. Price action below this level typically invites higher volatility, as we saw with the NDX and QQQ in February after they lost 25,557 and 621, respectively, on February 3rd.
Today’s edition features the updated levels for MARCH. As usual, I’ve highlighted securities trading below their CML. Spoiler alert: Only nine names closed today above their March CML, and only one of them is a tech stock.
This publication consistently analyzes the following securities to provide a broad market perspective and empower your trading decisions. Maintaining a consistent watchlist is key to improving performance and timing:
Indices & Futures: SPX, NDX, DJI, IWM, ES=F, NQ=F
ETFs: SPY, QQQ, SMH, TLT, GLD, SLV, DIA, SH, PSQ
Major Stocks: AAPL, MSFT, GOOG, AMZN, NVDA, META, TSLA, BRK.B, LLY, WMT, AVGO, COST, JPM, XOM, PLTR, NFLX, V
Crypto & Related: Bitcoin, Ethereum, ETHA, IBIT
Leveraged ETFs: TQQQ, SQQQ, UDOW, SDOW, UPRO, SPXS, URTY, SRTY
Weekly Levels
Of course, they’re all here. This week, these levels successfully set the bullish targets for $QQQ (615.0) and $SMH (422.1), including the SMH extended target of $429.2. We also hit the extended target for GLD at $484.0 and the $694.4 level for the SPY.
Since our risk management and validation points are built directly on these levels, let’s deep-dive into the Weekly and Monthly Levels. Following that, I’ve included a Combined Price Matrix to help you assess targets and manage risk for both bullish and bearish setups. These levels are modeled on historical data and have proven their accuracy for this community since March 2024 when this Substack was launched.
Why are these levels more important now than at any time since February 2025?
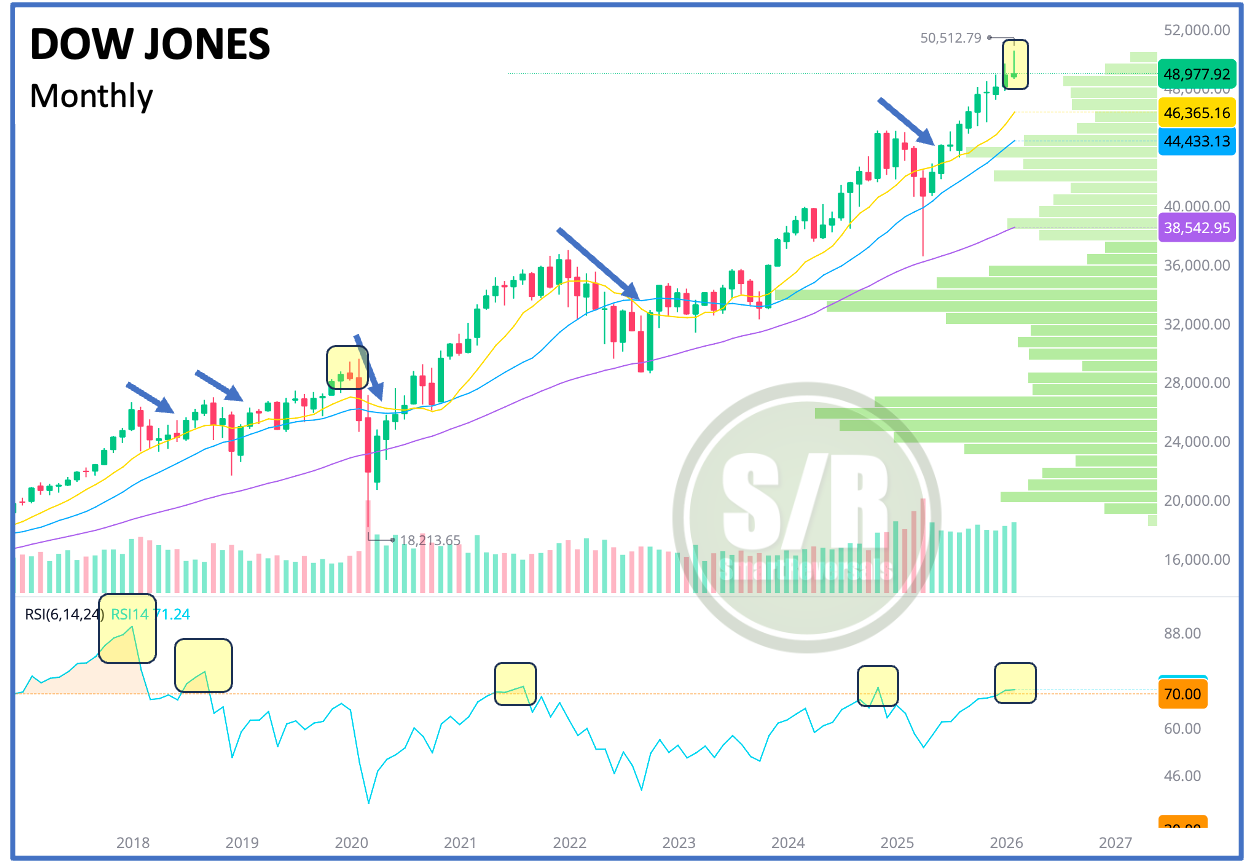
Historically, the Dow Jones has signaled major reversals under two specific conditions:
The monthly RSI exceeds 70 (as seen in 2018, 2022, and 2025).
A monthly reversal candle is formed (as seen in 2020).
Currently, both signals are flashing: the RSI has hit 71, and a gravestone doji has formed. This indicates that the price has erased its monthly gains, signaling a significant loss of bullish momentum.
Signals need confirmation, the modeled support and resistance levels are here to help navigating March:
WEEKLY LEVELS