


U.S. stock indexes finished mixed today, marking the close of both the month and the third quarter. Growth and technology stocks carried the Nasdaq 100 (NDX) into positive territory with a 0.2% gain. However, the S&P 500 (SPX) slipped 0.25%, and the Dow Jones (DJI) dropped 0.9% (DIA exceeded the bearish target of 511).
Early-day optimism made the SPX reach the anticipated daily resistance of 7,720 and reversed rapidly towards 7,649, another level modeled yesterday for today’s session showing a how institutional algorithms react to these modeled levels with precision. Long-dated bond yields continued to weigh down the broader market, with the 10-year U.S. Treasury yield jumping to a new multidecade high of 5.30%.
The market wrestled with contradictory economic signals:
The Federal Reserve’s preferred inflation gauge, the August Personal Consumption Expenditures (PCE) price index, came in lower than expected rising 0.3% for the month and 3.4% year-over-year (vs. 3.7% expected). Core PCE (excluding food and energy) rose 0.2% for the month and 3.0% year-over-year. However, the second-quarter real GDP was revised upward to a 2.2% annualized growth rate, proving the U.S. economy remains resilient and offsetting the cooler inflation data.
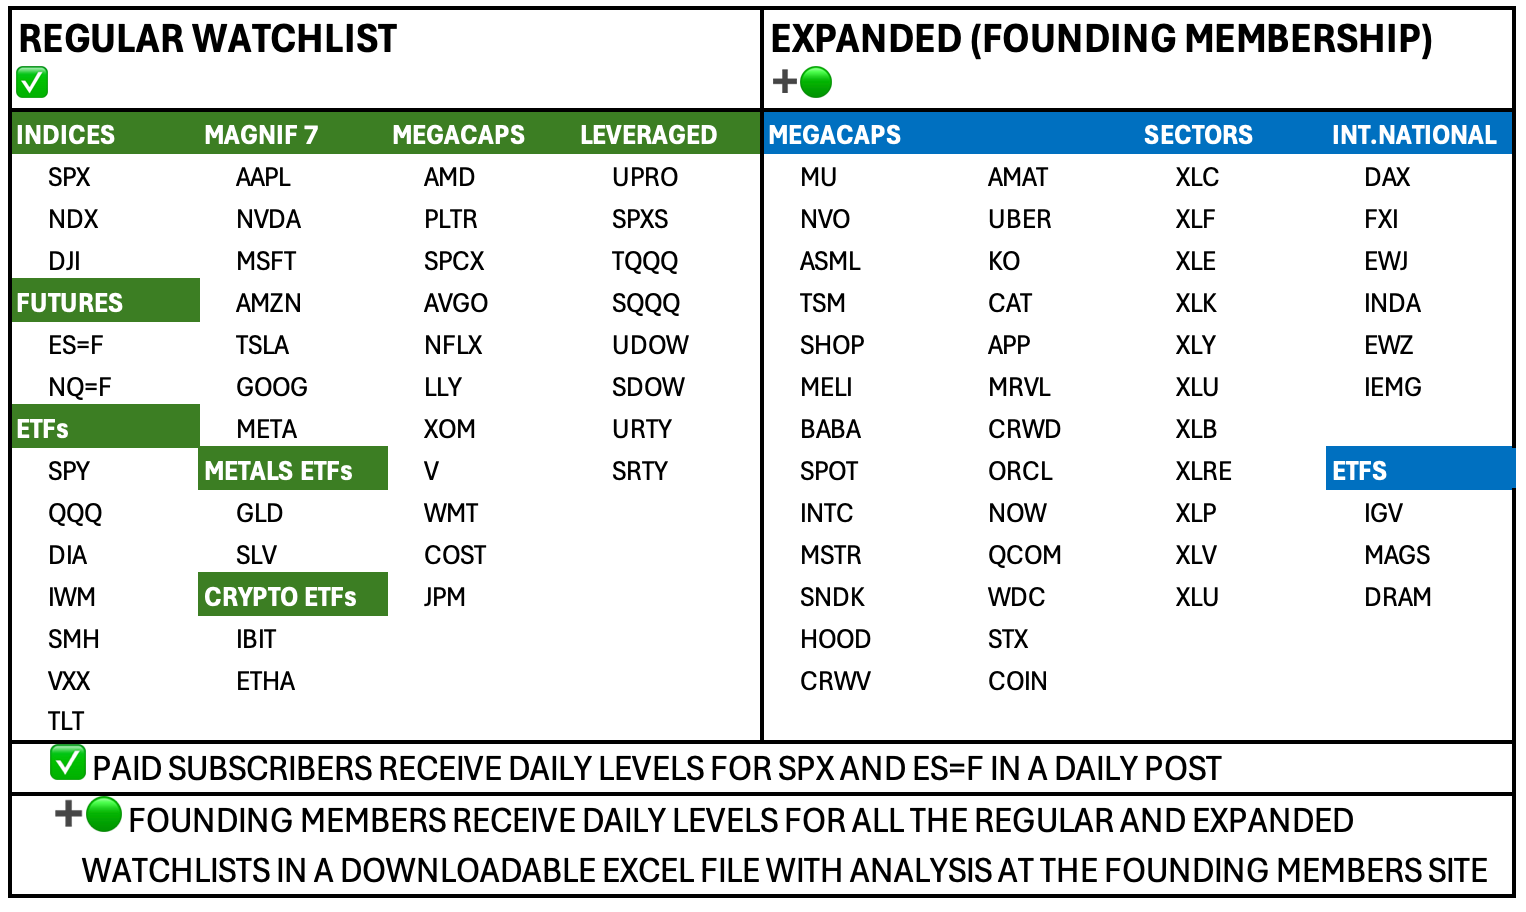
As mentioned today is the end of the month and quarter, and many disciplined investors and traders are looking forward to the support and resistance levels for October, and that is the focus of today’s edition, bringing the essential central monthly level (CML) that sets momentum for a longer term structure, this level comes for our regular watchlist in this post, and the founding members site (access here) has the levels updated for the expanded watch as well.
Today’s Agenda
Monthly Levels for October
Watchlist Tracker and setups analysis for SPX, QQQ, TSLA, AMZN, SPCX, GOOG
Micron Earnings Report Breakdown
Multi-timeframe levels combined for SPX, ES=F, MU, NVDA, AVGO, AMD
Daily plan for SPX, ES=F
Let’s begin.
MONTHLY LEVELS FOR OCTOBER
Securities marked in red indicate they have lost the crucial central monthly level, making volatility likely, especially if the ticker is close to its all-time highs, such as the Dow Jones or DIA and IWM (both anticipated as bearish setups). At the same time, let's remember that bounces occur from oversold conditions. Some tickers are showing overextended conditions and could trigger corrective moves similar to those anticipated and printed by SPCX, BTC, TSLA, NFLX, and GLD in August, or META, AAPL, and AMD in September. Let's examine the analysis first: