


The Q2 2026 earnings season has revealed a divergence between the broader market and the highly scrutinized mega-cap technology space, while Wall Street banks and key defensive sectors like healthcare have delivered strong results.
In the tech sector, sharp post-earnings stock declines for mega-caps like GOOG and TSLA were generally not caused by poor revenue or core business growth. Instead, a clear pattern of “AI cash burn anxiety” emerged. Both Alphabet and Tesla handily beat top-line expectations, with Google Cloud revenues surging and Tesla delivering solid vehicle metrics. However, Alphabet’s massive infrastructure spending pushed its quarterly free cash flow into a negative deficit, while Tesla’s core automotive margins narrowed due to EV price wars and heavy AI investments. Investors are no longer content with just impressive AI growth, and the market is aggressively punishing companies where massive capital expenditures actively drain free cash flow before showing direct, near-term monetization.
Why is the NDX 9% Below All-Time Highs While the SPX Is Down Just 3%?
In contrast to the tech sector’s volatile reception, major U.S. financial institutions kicked off the earnings season with strong results. JPMorgan (JPM) led the financial sector posting robust net profits and beating consensus EPS expectations. The overarching theme for big banks, including BAC, GS, MS; is a resurgence in capital markets. Wall Street trading desks and investment banking advisory fees surged, driven by a macro recovery in global mergers and acquisitions and high-volume equity trading, while consumer credit profiles remained stable.
Adding a vital defensive pillar to the broader market narrative, the healthcare sector delivered heavyweight support led by UnitedHealth Group (UNH), with a stellar Q2 report that crushed Wall Street expectations. Its medical care ratio improved signaling that medical cost utilization and Medicare Advantage pressures are normalizing faster than anticipated. Bolstered by disciplined cost management and raised full-year guidance. The broader healthcare landscape shows that defensive companies with pricing power and cost controls can insulate themselves from macro headwinds, offering a stable safe haven while capital cycles rotate away from overextended growth areas.
The Energy sector is being fueled by oil prices, the sector is projected to post the highest year-over-year earnings growth rate of all eleven S&P sectors, surging over 100%. This week XOM, SHEL, and CVX will post earnings reports and we will learn the actual effect of oil prices.
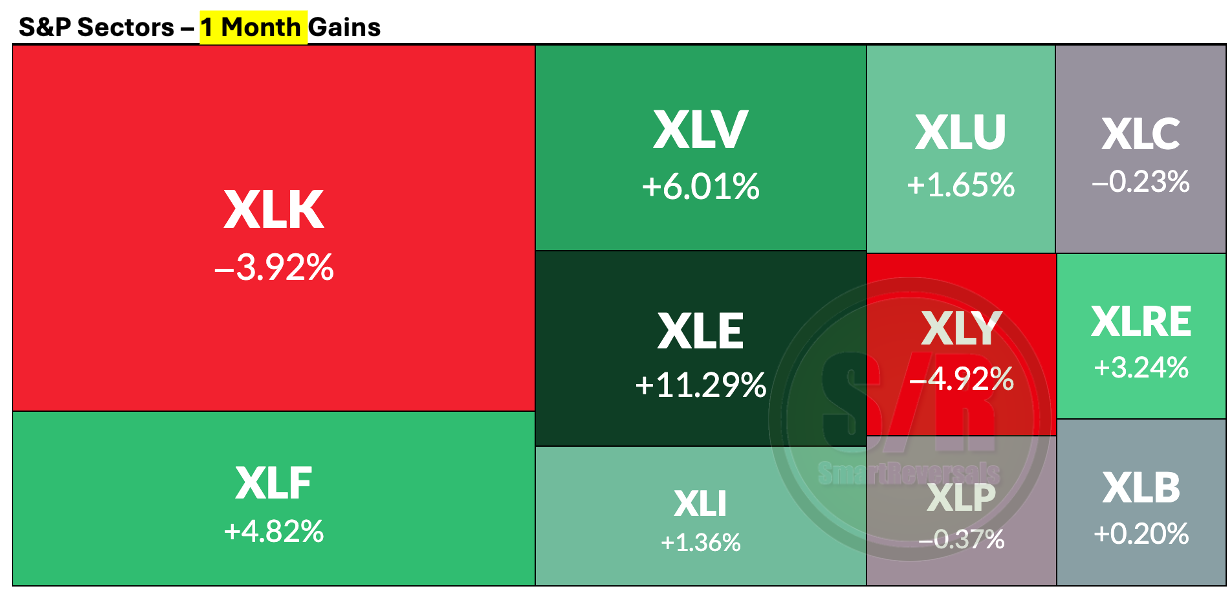
With that said we have three observations:
Corporate America remains profitable on an index level, with blended year-over-year S&P 500 earnings growth tracking near multi-year highs. From the fundamental or micro perspective the outlook is promising.
Capital is shifting away from priced-to-perfection AI hardware and software giants and flowing instead into historically disciplined, cash-flow-supportive sectors like financials, healthcare, and select cyclicals. The problem with that is the influence of technology in the general market and consumer discretionary.
Monitoring megacaps and high volume assets in general from different sectors is a healthy discipline, last week the anticipated bullish moves for JPM, IBIT, ETHA, GLD reached their targets, as the bottom I called for XOM three weeks ago continues working, the stock is up +15% from the bullish reversal call.
Unlock the premium content by upgrading to the paid plan. The complete set of charts and price targets for next week are below. The previous publications and this one are available at smartreversals.com.
With major companies reporting earnings next week, my daily note with SPX levels will also provide bullish-above and bearish-below levels along with their targets for the following securities: MSFT, AAPL, AMZN, META, XOM, V, QCOM, and KO (which are all posting earnings), as well as SPCX, which is technically oversold and will post earnings the following week.
Today’s Agenda
Market Context: Charts+levels for SPX, Indices, ETFs, VIX, Breadth, and Crypto.
Deep Dive: Individual analysis with charts and targets for Mag Seven and setups.
Momentum Map: Analyzing the stage of every security in a single view.
Setups Blueprint: Entry levels for short and long setups with price targets and invalidation levels for all the securities in the watchlist prioritizing stronger setups.
Let’s begin.
SPX: Next Week is Critical
This is a market with major moves overnight driven by not one, not two, nor three macro factors, but next week it will be driven by four macro factors (1) Conflict in Iran, 2) tariffs (Foreign Retaliation and/or White House Expansion Threats), 3) Fed meeting and PCE, 4) tech investors questioning when the major capital expenditures will be recovered) plus a fifth factor: the earnings report of many of the biggest companies based on market capitalization. This choppy market has brought major swings overnight and next week it is not expected to be any different.
Non-tech sectors have provided support for the S&P500, but if the market's reaction to next week's earnings reports mirrors the negative sentiment seen with GOOG and TSLA, the sell-off will likely continue. Last week for example, the expected bullish continuation for PLTR lost its central weekly level, while the anticipated bearish move for AMZN played out as projected, clearly accompanied by high volatility. Overall, last week proved to be a difficult period for the technology sector, dragging down the SPX and causing it to lose its Central Monthly Level on Thursday, which then acted as resistance on Friday as anticipated.
Technical conditions presented with the charts below provide a roadmap and tools to navigate this context, indicators give us direction probabilities, and price levels provide confirmations. Let’s begin with the SPX chart and then we continue with VIX, Breadth, and NDX to present the likely destination for this market move: