
Navigate Turbulence Using Support and Resistance Levels
Assessing High Probability Setups 🎯 🎯 🎯

Over the past three weeks, the high probability trades have performed with a high level of accuracy. These setups always include a target price and an invalidation level which, in most cases, is the Central Weekly Level (CWL).
The purpose of posting targets is to establish an objective metric based on price action. This gives you an edge in anticipating potential reversals, which is why targets are placed at these specific zones.
Take this week, for example. The Weekly Compass anticipated a bullish move for BRK.B, targeting $505.4 for a 1.2% upside. Price reached that level as early as Monday afternoon but retraced quickly on Tuesday. This illustrates the importance of using levels: once a target is reached, it becomes new support. If that support is breached (as happened on Tuesday), profits should be locked in.
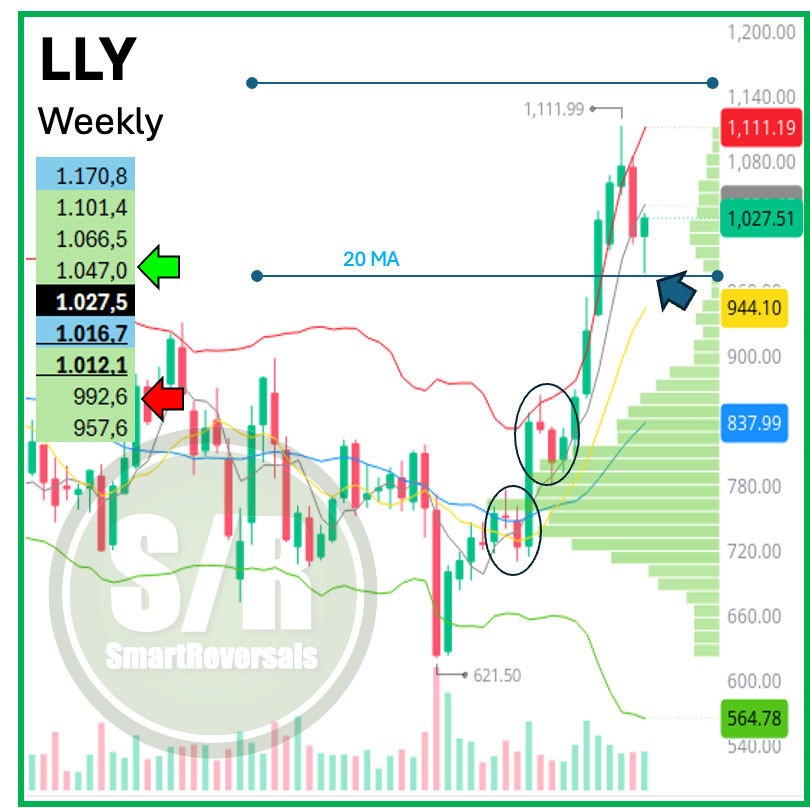
Why set the new level conquered as a stop? Because price can continue running. This occurred with LLY, which targeted $1,047 (1.9% upside) but extended to $1,066.5 for a 3.8% rally on Monday. Notably, $1,065.5 was one of the key levels provided on the S/R levels and in the Weekly Compass; after hitting that milestone, the price reversed sharply. Premium subscribers, however, had full visibility of the layers above the initial target. Below is a segment of the chart from the Weekly Compass, with the key levels listed on the left:
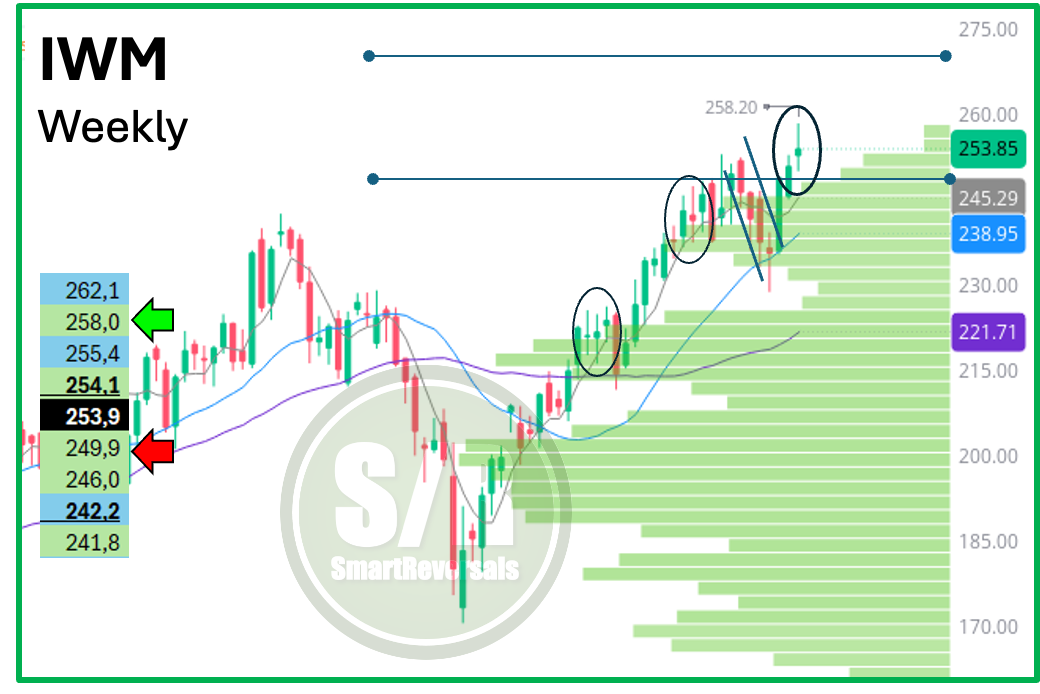
Conversely, IWM was a high-probability bearish setup. The price successfully dropped to $249.9 (-1.6% decline), and as that level breached, it is now aiming for the next support at $245. Below is a segment of the chart from the Weekly Compass, with the key levels listed on the left:
While these three forecasts hit their targets, not every setup plays out. PLTR, for instance, had a bullish setup targeting $190, price action was bullish on Monday but the momentum faded. In this scenario, the CWL served as the clear invalidation reference, signaling an exit when $183.9 was lost and protecting capital from the recent selloff.
Today, we examine how to effectively execute high-probability setups alongside S/R levels.
This approach has recently yielded strong results, with a bullish setup on TSLA exceeding its target and bearish calls on NVDA and AMD paying off well.
This review is timely, as we are upgrading the Weekly Compass this Saturday to consolidate all setups into a single, unified view. Consider this publication your guide to mastering these tools. Remember: Having the levels is only half the battle; you must apply technical analysis to assess whether a reversal or consolidation is likely.
Today’s Case Studies: TSLA, PLTR, IWM, NVDA, NFLX, COST, BRK.B, AMD, LLY, and of course, SPX (7 out of those 10 reached their targets for a 70% accuracy level).
🎯 TSLA - Bullish Setup Reaching the Second Target
We studied the technical indicators that anticipated a bullish move, this is the segment of the chart that considered $469 (+2.3%) and also $480.2 (+4.6%), this is a way to play the levels: