
Navigating an Overextended Rally - Key Levels to Watch
Why Risk Management and Key Price Levels Are Crucial for the Week Ahead


The stock market demonstrated impressive resilience this week, rallying despite the noise and panic generated last weekend by the US intervention in the Middle East conflict. This is a fantastic example of why price action should be trusted over social media noise.
The best tool to protect against premature decisions is a reliable set of levels, which my weekly support and resistance levels provide. This was the case for the levels that framed the week's price action, including $5,990.4 for SPX, $21,719.7 for NDX, $596.5 for SPY, and $529.0 for QQQ. Notably, NVDA broke out and shorting that one when it was above $144.2 was a big no based on last weekend’s edition, while PLTR and LLY breached their central levels triggering a bearish reversal.
Get the Support and Resistance levels for next week in the previous publication, it contains three links to educational content for everyone about using these levels which are based in a predictive approach.

The rally was fueled by what the market interpreted as good news: weak or bad economic data. With GDP falling -0.5% and jobless claims rising above consensus, housing starts below expectation, the prospects of a Fed rate cut have increased. This is bullish for the market in the short term, though the long-term implications are less certain.
To understand the historical context of such moments, I highly recommend visiting these essential publications on Fed rate changes since 1990 with the immediate and long term effect in the S&P500 with technical indicators before we begin today's technical immersion. I conducted those studies in September 2024 when the FED began with such cuts, thankfully for bulls the FED has moved slowly, you will learn why when reading the series of publications:
When you upgrade your premium plan you have access to every publication mentioned today, and all the content at www.smartreversals.com.
Pullback Delayed?
My data and technical-driven approach continues to prove we are in a bull market where timing pullbacks is difficult, just as I anticipated on April 26th. Today, we will revisit last week's Nasdaq 100 analysis that opened up the bullish continuation for the week that just ended, and what indictors and levels must be tracked carefully
Let’s begin with Small Caps
IWM
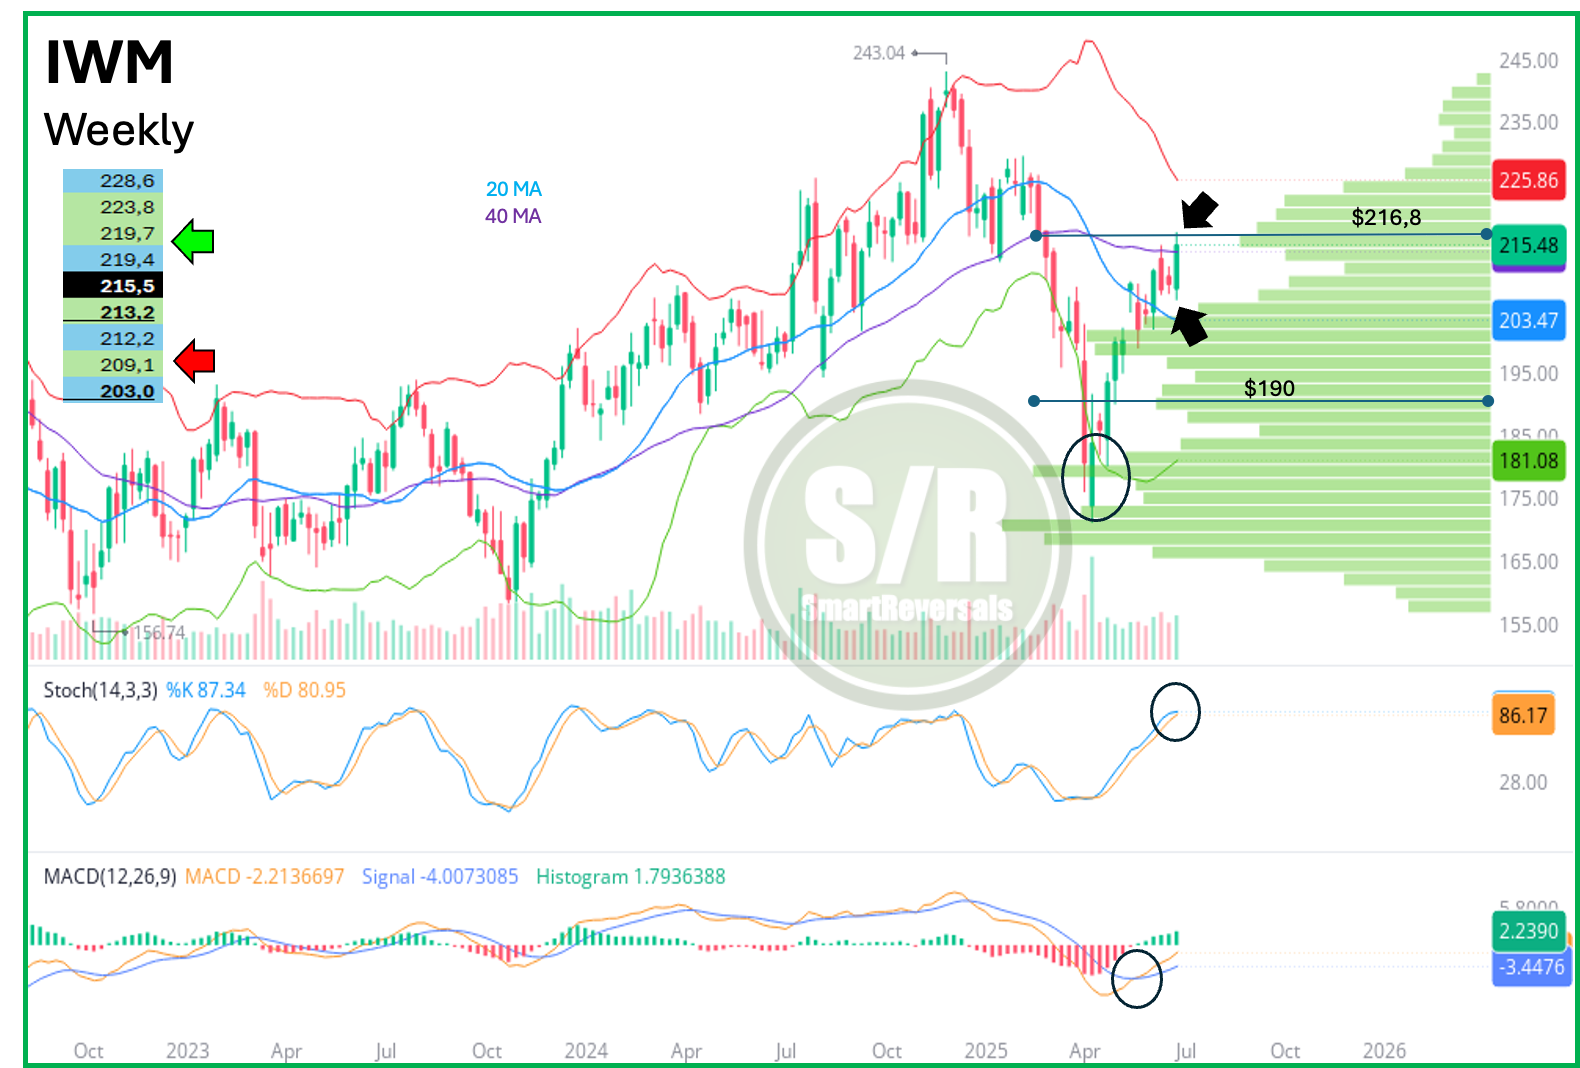
Literally last week, I anticipated a potential visit to the 20 weekly average followed by bullish continuation, the price effectively started in the red the week bouncing at the bearish target using the S/R levels, which was $207.3 and then it bounced. It is a good example why the S/R levels are more accurate than moving averages, I use averages to calibrate the trend, but they don’t always work with some accuracy.
The setup for this ETF is bullish as it was anticipated since April, and the fact that the moving averages included have been surpassed validates the bullish thesis.
In the very near term, and speaking about precision, the annual $216.8 level set exact rejection in confluence with the point of control (peak) of the volume shelf, so consolidation is very likely at this point for a couple of days before bullish continuation to the upper Bollinger band. In the near term, let’s be centered around the $213.2 mark. If this level holds as support, the immediate bullish target is $219.7 next week (a rejection would be normal considering it confluence with the monthly level). On the other hand, if the central weekly level at $213.2 is breached, a bearish reversal could target $209.1, with a temporary potential support at $212.2.
For educational content about the technical indicators mentioned in this publication, click on each link according to your interest: Stochastic and RSI oscillators, Candlestick patterns, Moving averages, Bollinger Bands, and Volume at Price. For the complete library, including other indicators like the McClellan oscillator, and studies of reversals and technical patterns in the stock market, click here.
Last week's public analysis of PLTR serves as an excellent case study for this technical methodology. I outlined a bearish context for the stock, which subsequently declined by -4.78%. for the week.
The pre-defined levels performed with precision. The key resistance at $148.2 capped the rally, and following a fake breakout, the support zones at $142.8 and $139.4 offered disciplined traders clear decision points to protect capital before the selloff accelerated.
Every Saturday this Weekly Compass studies consistently the following securities to provide a broad market perspective and empower your trading decisions:
Indices: SPX, NDX, DJI, IWM, SMH
Metals and Bonds: GLD, SLV, TLT
Major Stocks: AAPL, MSFT, GOOG, AMZN, NVDA, META, TSLA, BRK.B, PLTR, NFLX
Crypto & Related: Bitcoin, IBIT
If you trade some of them, this publication is for you.
Unlock why AAPL could be about to make an explosive move and the key level to validate it before it’s too late. Get also an assessment for TSLA, that is presenting a must watch pattern, and of course, the bullish target for SPX and NDX before a significant correction occurs (similar to my call since September regarding a correction from $6,100).
SPX - Short Term Overextension, What About Medium Term? - Implications: