
Navigating Earnings Waters - Week Ahead
Anchor Your Decisions with High Probability Setups in Times of High Volatility

U.S. stocks concluded a very volatile week with divergent performance, as strength in mega-cap technology shares counterbalanced broad-based weakness elsewhere. The S&P 500 finished -0.35% for the week, the Nasdaq Composite gained 0.3% for the week, and the Dow Jones Industrial Average retreated 0.6%. Investor sentiment remains anchored in neutral territory, with the Fear & Greed Index reading 52.
The bearish move anticipated last week played out exactly as expected. The NDX hit its 20-week moving average with a -2.3% move, the VIX spiked as forecasted, and our thesis of an overcrowded trade with excessive participation was confirmed.
While the technical conditions already favored a pullback, the weekend’s news acted as a catalyst, accelerating the selloff with unexpected velocity. I typically post targets and extended targets meant for multi-day or multi-week moves; however, by Tuesday, those extended targets had already been met. The SPX even hit our “worst-case” weekly target of $6,787. (You can find all these layers in the S/R Levels edition published on Fridays, and in the charts of this Weekly Compass).
This overextended move triggered reversal alarms, by Tuesday afternoon when the market closed I sent a note to all subscribers highlighting the overextended move in the VIX and providing two numbers for Wednesday: $6,819 for SPX, and $610.1 for QQQ; if those two were recovered by Wednesday we would start seeing valid signs of a bullish reversal, and after them, $6,836.8 and $613 respectively. What happened next was a multi-day bounce that recovered the losses of Tuesday.
This is why it’s vital to have a professional perspective on technical indicators, it allows us to anticipate price direction and use well-modeled support and resistance levels to anticipate reversal zones and targets.
Unlike traditional analysis, my levels aren’t just based on historical lines; they are modeled for the period ahead (both weekly and monthly). Since this Substack launched in 2024, premium subscribers have witnessed the consistent accuracy of these levels firsthand. The ones for next week are out, click here.
Gains in technology and consumer discretionary shares provided essential support on Friday. Microsoft surged over 3% and Nvidia climbed 1.5%, offsetting persistent semiconductor weakness; Intel plunged roughly 17% on disappointing guidance. Financials proved the session’s biggest drag, falling 1.4% after Capital One slumped nearly 8% on an earnings miss.
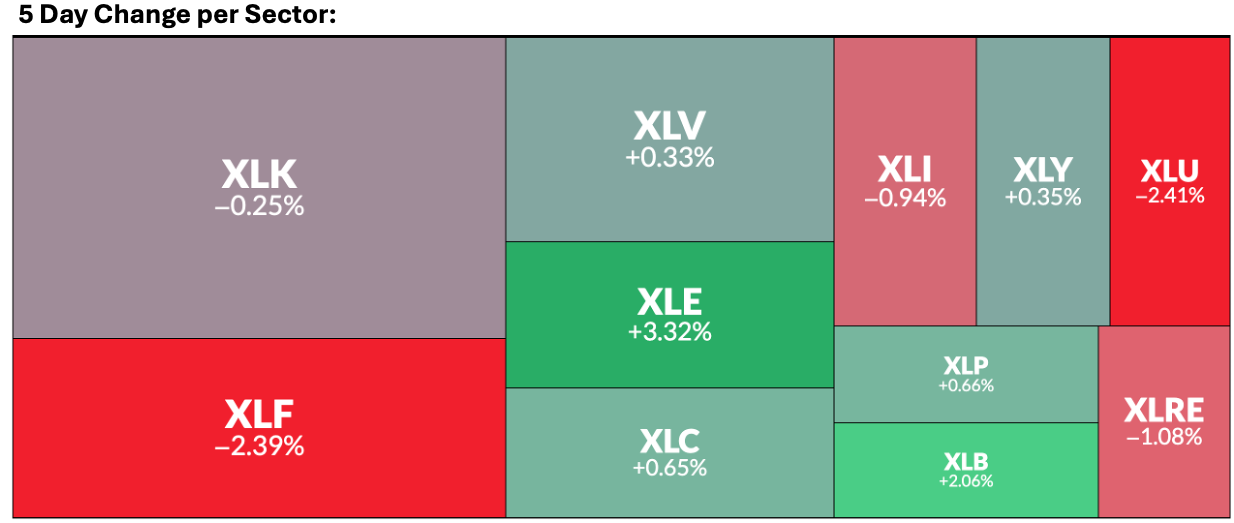
Small and mid-cap stocks faced significant selling pressure. The Russell 2000 dropped 1.8% on Friday diverging from the S&P500 and the Nasdaq100, we will study the IWM as usual below in the premium section.
Investors are now turning their attention to a high-stakes earnings slate next week featuring reports from four “Magnificent Seven” giants: Microsoft (MSFT), Meta Platforms (META), Apple (AAPL), and Tesla (TSLA). These results will likely determine market direction as major indices hover near record highs. As I have mentioned weeks ago “it will be interesting if megacaps are oversold by earnings reports”, which is the case for all the four mentioned. The analysis for all of them is below, with their respective targets. They are a must read for the week ahead, find them in the paid section below.
This publication permanently track the market’s Megacaps and leaders to give you a broad market perspective. This constant focus allows you to time reversals for individual names and to anticipate capital rotation before the crowd does. Our watchlist includes:
Indices: SPX, NDX, DJI, IWM, ES=F, NQ=F
Majors: AAPL, MSFT, GOOG, AMZN, NVDA, META, TSLA, BRK.B, LLY, WMT, AVGO, COST, JPM, PLTR, NFLX
ETFs & Commodities: SPY, QQQ, SMH, TLT, GLD, SLV, DIA, SH, PSQ
Crypto: Bitcoin, ETH, IBIT, MSTR
Leveraged: TQQQ, SQQQ, UDOW, SDOW, UPRO, SPXS, URTY, SRTY
Our analysis consistently captures major swings. Examples include bullish calls for TSLA and AAPL in July 2025 while they were still laggards, followed by timely bearish reversal calls in December based on specific technical signals. For Bitcoin, we have been bullish since April 2025 and turned bearish in October. Additionally, our Momentum Map successfully anticipated the LLY breakout in November and COST three weeks ago. All of them posted double-digit percentage gains; you don’t have to hunt for unknown companies; you can, but the risk is much higher.
We have been bearish on AAPL and TSLA since December based on specific price signals highlighted to paid subscribers. These are the types of swing moves that help you time the market effectively. Each week, this publication highlights high-probability setups, allowing you to monitor your preferred stocks for potential breakouts or selloffs, much like the notable JPM and PLTR moves mapped two weeks ago.
Since November, 76 high-probability setups have been posted, 57 of which were successful, maintaining a 75% success rate.
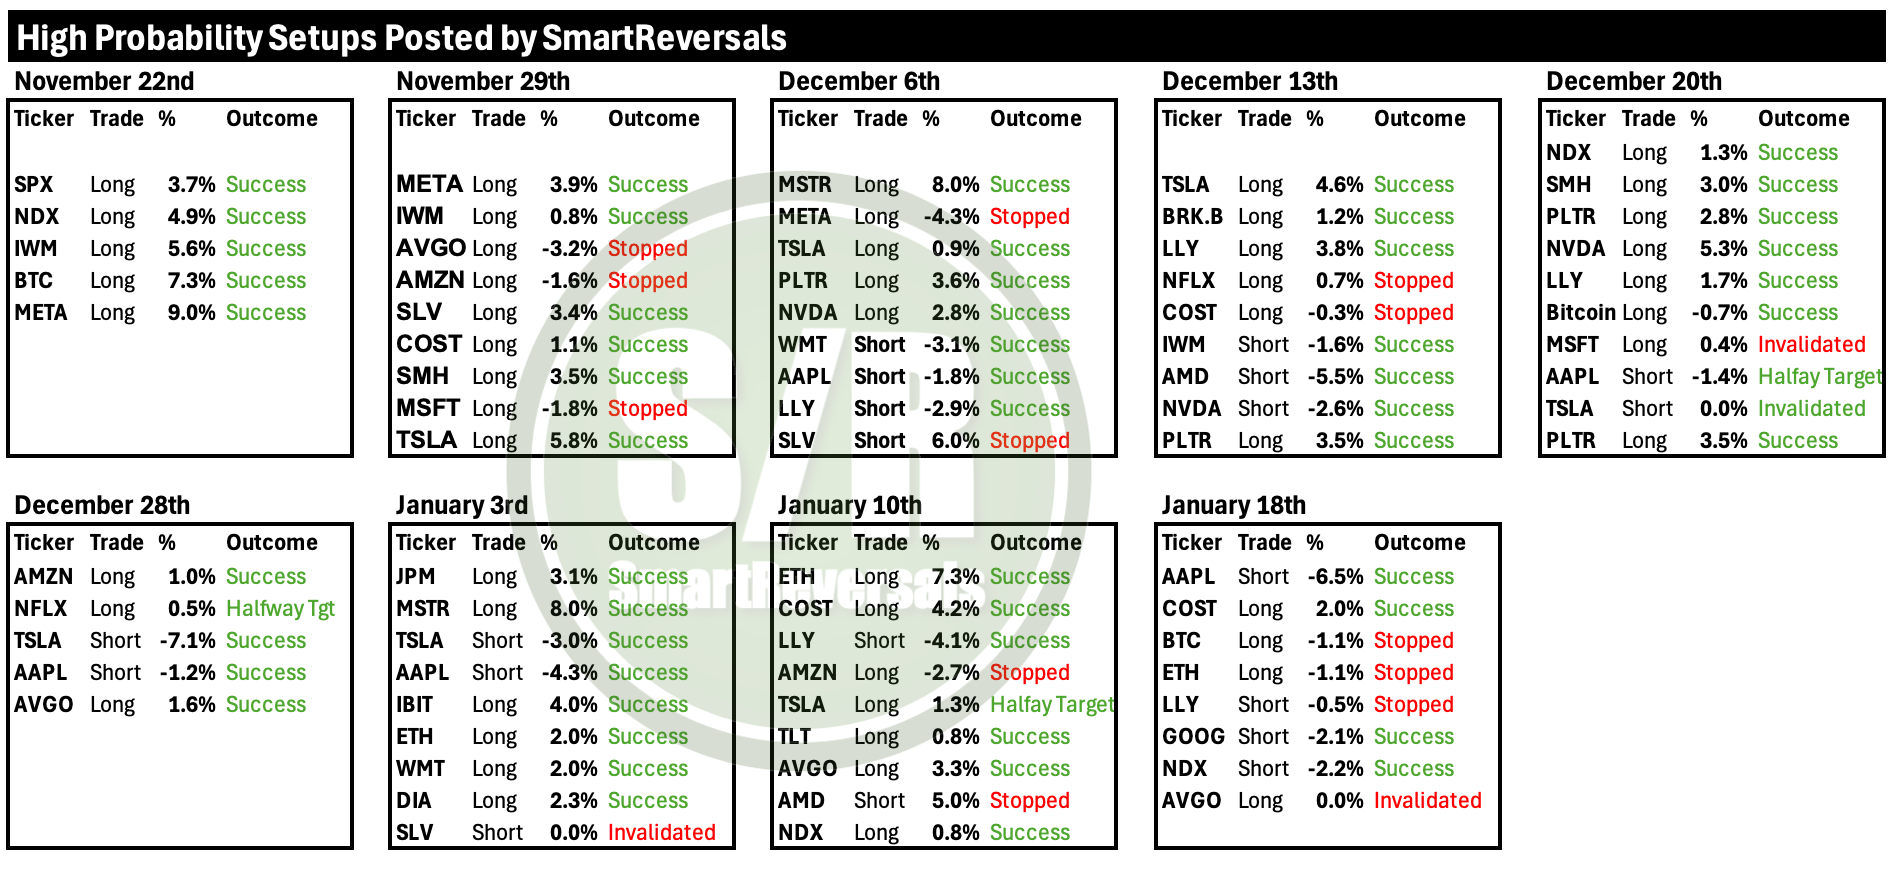
Every setup is provided with a primary price target, an extended target for high-momentum moves, a clear invalidation level to define your stop loss. There is no 'gut feeling' here, every move is backed by a technical thesis and modeled prices.
Even in highly volatile weeks like the one just ended, our high probability setups delivered an average gain of +3.2% across both long and short positions, with an average loss of only -0.7% for the setups that were affected by the rapid selloff. The week that just ended was brutal, and despite of that, this professional approach over-performed. Note that the full setups menu is much broader than what is presented in this preview, the bearish targets for TSLA, BRK.B, AMZN, PLTR, MSFT, META, and NFLX were reached. Ensure you have the right tools to navigate the current market. Subscribe now, this market neutrality and setups pay the subscription.
Will the stocks mentioned continue in bearish mode? Not necessarily, there are opportunities out there, subscribe now to unlock all the setups for the week ahead.
Today’s Agenda:
The Momentum Map
Setups for 30 Tracked Securities: Highlighting High-Probability Moves
Technical Analysis for Each Major Index, Volatility, Breadth, and Bitcoin
Individual Technical Analysis for Metals and Stocks
Momentum Map
Today’s map presents shifts in many quadrants, we have new participants gaining momentum as LLY and WMT did in previous weeks, we have stocks finally entering in official weakening mode, and we also have new laggards, there are opportunities for bulls and bears ahead as follows: