
Navigating Post-Rate Cut Volatility
Assessing rotation, risk, and high-probability setups as we head into the second half of December


The anticipated volatility outlined in last week’s Weekly Compass played out exactly as expected. Price action oscillated around the Central Weekly Levels (CWL) for major indices: $6,855 for SPX, $25,559 for NDX, $684 for SPY, and $622 for QQQ. We saw a breakout attempt on Wednesday following the confirmation of the rate cut, which was quickly met with a choppy Thursday. By Friday, the market reversed rapidly; a classic signature of a rate decision week.
However, a divergence emerged early in the week: both the Dow Jones and the Russell 2000 showed bullish strength, suggesting a potential rotation under the surface. Despite this, Friday’s decline was broad, exposing weakness across both the stock market and the crypto space. This signals a need for caution. As we move into the second half of December, where seasonality typically favors the bulls; it is crucial to analyze price action and critical levels carefully. Today, we will assess current conditions and the implied risks for the short term.
High Probability Setups: A 78% Success Rate
Over the last few weeks, the Weekly Compass has featured a new section: “High Probability Setups” This summarized guide helps premium subscribers navigate the 30+ securities we analyze weekly by highlighting the absolute top picks. Three weeks ago, we identified five strong setups; in the last two weeks, we found nine. Today, we are watching nine must-see setups.
The performance speaks for itself. The table below details whether each called setup was bullish (long) or bearish (short). Out of 23 trades shared, 18 have successfully reached their bullish or bearish targets, some of them surpassing them. This 78% success rate serves as a transparent transparency report and a clear message: it’s time to upgrade to the paid plan.
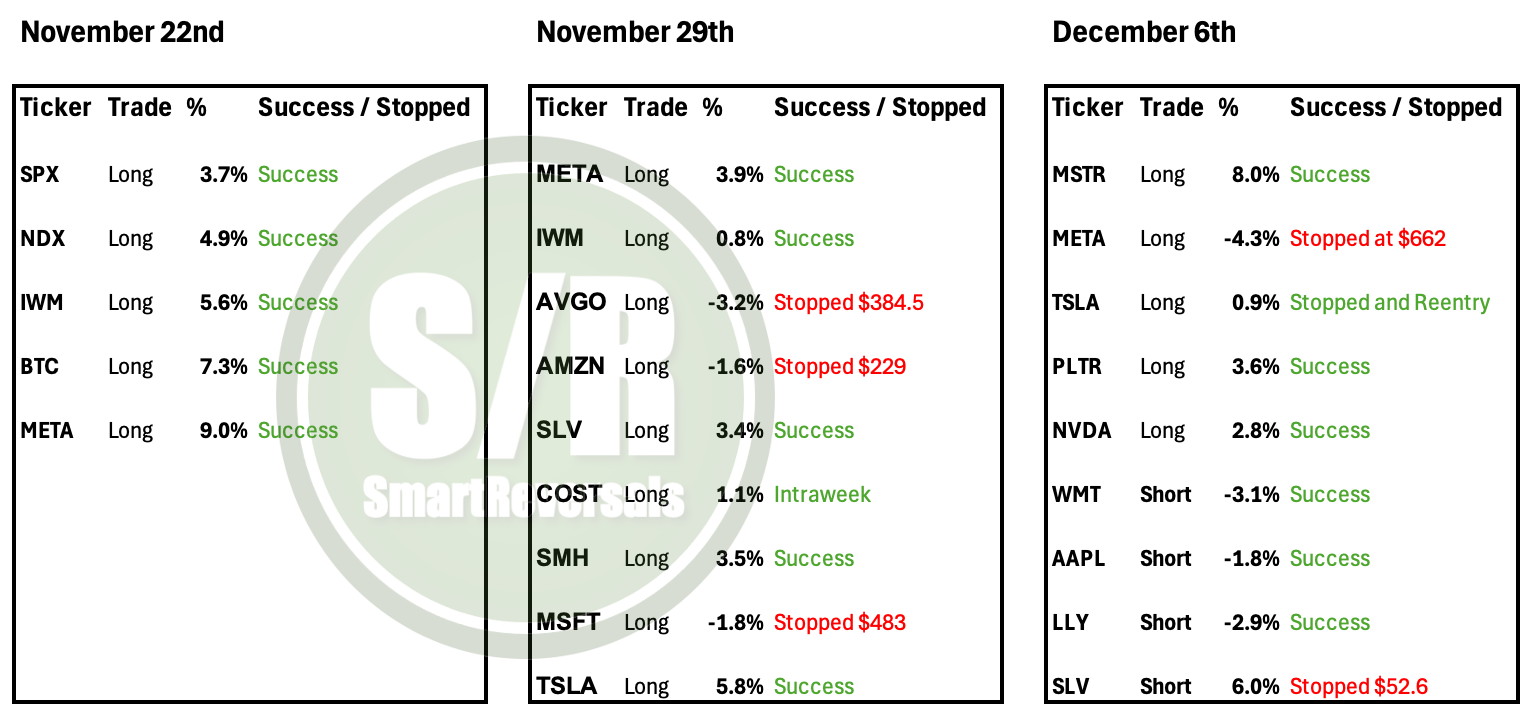
The momentum map, my carefully selected technical indicators, and a solid grasp of fundamentals form the essential combination for success. Crucially, this strategy relies on Support and Resistance Levels, specifically the Central Weekly Level (CWL), which defines momentum and validates a bullish or bearish thesis depending on whether the price holds above or below it.
When a trade moves against expectations, the CWL plays a vital role in signaling invalidation. This gives traders a clear reference point to set stop-losses based on their individual risk tolerance.
Today’s High Probability Setups feature 6 bullish and 3 bearish opportunities ready to be monetized. For each, the CWL acts as the line in the sand. For example, when META dropped -4.3%, the CWL at $662 served as a stop reference; a trader exiting slightly below that level would have limited the loss to roughly -1.6% considering Friday’s close, rather than absorbing the full drawdown. The same logic applies to short positions: if the CWL resistance is breached, the setup is invalidated.
This tool is designed for traders who cannot watch the screen 24/7, helping you make informed entry decisions and set protective stop-losses immediately upon execution.
This publication consistently analyzes the following securities to provide a broad market perspective and empower your trading decisions:
Indices & Futures: SPX, NDX, DJI, IWM, ES=F, NQ=F
ETFs: SPY, QQQ, SMH, TLT, GLD, SLV, DIA, SH, PSQ
Major Stocks: AAPL, MSFT, GOOG, AMZN, NVDA, META, TSLA, BRK.B, LLY, WMT, AVGO, COST, JPM, PLTR, NFLX
Crypto & Related: Bitcoin, ETH, IBIT, MSTR
Leveraged ETFs: TQQQ, SQQQ, UDOW, SDOW, UPRO, SPXS, URTY, SRTY
A broad view of the market allows investors to spot rotation opportunities. If you prefer to be focused on any of these securities, this publication helps you navigate their price action since they’re here every weekend.
Today’s agenda
Momentum Map
High Probability Setups
Charts and Analysis for Main Indices, VIX, Breadth, and Bitcoin
Appendix with Charts for ETFS and Megacaps