
Oil as the New VIX: History’s Blueprint for Extreme Moves
Special Oil Edition - Learnings from previous geopolitical conflicts

On Sunday night, Crude Oil reached the extreme overbought conditions that I highlighted using the chart below in my Substack Notes and on X. For the paid community, I provided that same analysis in our private chat, including the weekly levels where a reversal was most likely to occur.
The overbought conditions relative to the Bollinger Bands reached historic extremes, surpassing levels seen during the 1990 Gulf War and the 2022 invasion of Ukraine. Unlike the price-driven peaks of 2008, this overbought conditions are the result of rapid price action fueled by extreme sentiment and a geopolitical conflict.
The high of the week so far has been $119, near the modeled level of $122.9, the price has retraced since to $88, but there is still a lot of impact in the stock market. Today’s edition is a special about oil and what has happened in previous geopolitical crisis related to oil.
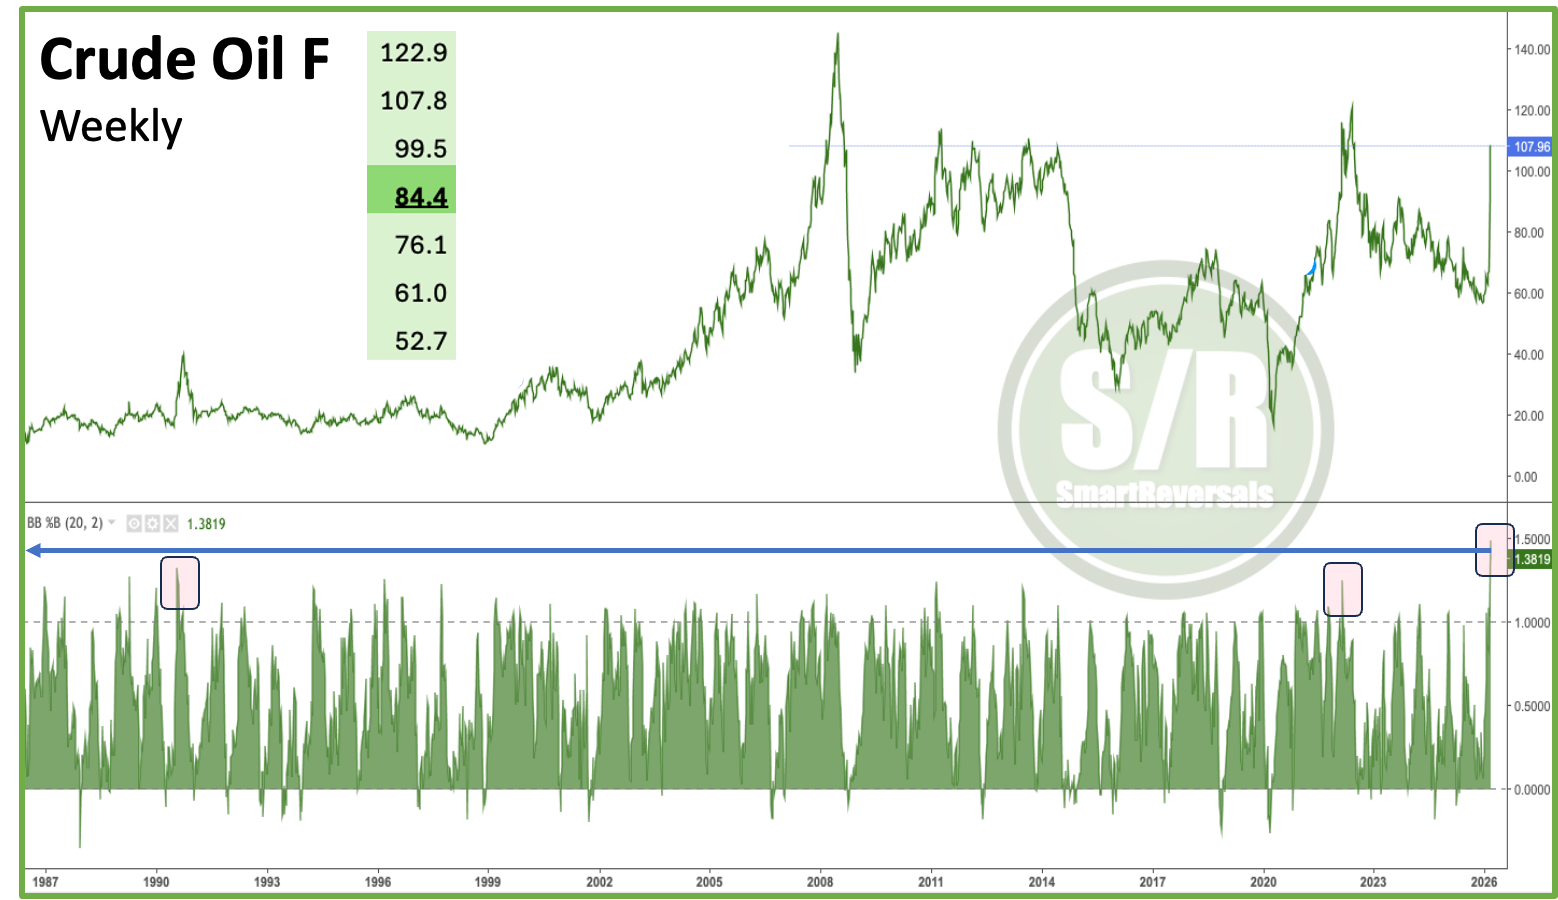
The updated chart following the extreme condition is below with other special charts.
We will analyze today the 1973 Yom Kippur War, the 1990 invasion of Kuwait, the 2022 invasion of Ukraine, and how those historical precedents frame today’s critical situation.
Before continuing let’s recall my note from the Weekly Compass published on Saturday about the SPX:
“Bearish moves rarely occur in a straight line, we have seen that during these recent weeks; therefore, a bounce is likely for the beginning of next week. In the unlikely event of a gap-down and continued selloff, the case actually becomes more bullish. Extreme oversold conditions often mark solid bottoms, as we saw in the previous 2024 and 2025 crashes.”
The extreme oversold conditions happened in the modeled range of the Support and Resistance levels shared on Friday, where $6,597 was identified for the ES Futures as an extended bearish level; the actual low was $6,584, just a few points from our modeled level. For the SPX, the rapid sell-off reversed on Monday morning, leading to a rally toward our weekly bullish target of $6,857.2.
QQQ moved with equal precision, bottoming at our support zone of $590.1 before bouncing to the $611 weekly bullish target. Both indices validated the reversal thesis (breach of the CWL) outlined in our setups.
As posted last week: Volatility is high today, but the accuracy of the modeled support and resistance levels continue. Moving forward, we are introducing a key addition to our high-probability setups as a metric of risk, but first, let’s analyze the current context for Oil.
Upgrade to the paid plan today. This is a must-read edition, providing the essential context needed to navigate the current environment. It also introduces a new tool designed to help you assess risk conditions for any setup in your portfolio.
Key Topics Covered Today
What Determines Whether Impact Is Short or Long-Lasting
Zoom to the Three Variables that Determine Duration
Technical Patterns in Previous Geopolitical Events
Sector-Level Impact - Divergences to Navigate
Key Market Conditions Added to the High Probability Setups
Let’s begin.
What Determines Whether Impact Is Short or Long-Lasting
the effects of geopolitical events last around three months on average, after which indices begin to mean revert to pre-event levels. The key finding was that the gap between performance after negative and positive events collapses by the three month mark, suggesting markets require roughly one quarter to fully price in the real economic implications of a shock.
The distinction between short-lasting and long-lasting impact comes down to three variables, each of which operates through a distinct economic transmission mechanism. These variables, not the severity of the event in human terms, are what determine whether a shock produces a one-week dip or a bear market.
The events that produced severe and sustained market damage share one or more of three characteristics: they disrupted global energy supply on a sustained basis, they altered the monetary policy environment, or they triggered financial system stress. The standard geopolitical shock rarely meets any of these criteria.
The 1973 Yom Kippur War and the Oil Embargo that followed represent the most instructive case study. The two events together, which occurred within 10 days of each other, produced a 43.2% S&P 500 decline over the following 12 months. This was not simply a geopolitical shock but a structural economic event: oil prices quadrupled, the U.S. entered a deep recession, and the inflation that followed shaped Federal Reserve policy for an entire decade.
The events when the stock market and oil prices resolved quickly, like the October 7, 2023 Hamas attack, show that despite extreme initial uncertainty, the S&P 500 returned 33.5% over the following 12 months. The event did not disrupt global oil supply, did not spread to major economies in a way that affected trade, and did not alter the Federal Reserve’s rate trajectory. All three variables came up negative. The market followed the historical pattern.
Markets price resolutions or complications, not the peak fear: The Cuban Missile Crisis of October 1962 is the most striking example of this dynamic. The world came as close to nuclear war as it has in the modern era, yet the S&P 500 gained 5.1% in the following month and 27.6% over 12 months.
Zoom to the Three Variables that Determine Duration
Energy Supply Disruption
Oil is the single most important transmission channel between geopolitical events and sustained market damage. Every multi-year S&P 500 decline coincides with a period of sustained oil price elevation. OPEC members currently account for over 79% of proven global oil reserves and 36% of production, meaning disruptions to producing regions carry disproportionate pricing power.
The mechanism is well-established: rising oil prices function as a simultaneous tax on consumers and businesses. They raise input costs across manufacturing, transportation, and consumer goods while compressing disposable income. If oil prices remain elevated for more than one quarter, they begin to alter inflation expectations and Federal Reserve policy, compounding the damage to high-multiple equities.
Federal Reserve Policy Interference
The second transmission channel, increasingly important in a high-valuation market, is monetary policy. When a geopolitical event raises inflation expectations, typically through energy prices, it reduces the probability of rate cuts or increases the probability of rate hikes. In a market where equity valuations are sensitive to discount rates, this effect is amplified significantly.
Russia’s invasion of Ukraine in February 2022 illustrates this channel precisely. The initial one-month return was actually positive at +5.9%, consistent with markets digesting limited direct economic impact and following oversold conditions in the SPX. But the following 3-month return was -15.4% (chart below). The primary mechanism was not the war itself but the energy price shock it triggered, which contributed (it was not the only factor, let’s be fair remembering when Jerome Powell stated in 2021 that “inflation was transitory” while printing money) to the highest U.S. inflation in 40 years and forced the Federal Reserve into its most aggressive tightening cycle since 1980.
Financial System Contagion
The third channel is financial system stress. When a geopolitical event threatens the solvency of major financial institutions or sovereign entities, the market impact extends far beyond the initial shock. Central banks cannot easily stop a bank run or prevent credit markets from seizing.
While geopolitical events can have profound impacts on local markets, they rarely have lasting effects on large-cap equity returns unless that financial system contagion channel is activated. Companies with strong fundamentals have weathered numerous geopolitical storms because their earnings power was not durably impaired.
Technical Patterns in Previous Geopolitical Events
The key objective now is to assess how this 2026 escalation compares to previous cycles analyzing the three variables that determine duration. While charts don’t repeat, technical patterns do, and the following charts provide the coordinates to consider what's coming. There are several patterns in the recent price spike that share a striking similarity to past moves with the same projected follow-through.