


Last Saturday, I noted that corporate earnings were more likely to drive near-term price action, especially with rate hike probabilities sitting at just 10%. During the week, I tracked the technical setup pointing toward a visit to 28,046 for NQ futures. In addition, my observations from last Saturday emphasized that volatility had not yet put in a definitive top; on the contrary, higher volatility remained the more probable path. I clarified that as long as the VIX held above 16.4, bullish conditions for volatility would remain intact, translating into persistent headwinds and bearish conditions for the SPX and equities in general.
Market declines are very choppy and emotionally punishing. Unprepared bulls get trapped buying green premarket or after hours ticks out of FOMO (fear of missing out), ignoring candlestick patterns, weekly structure, gaps, overextended conditions, and VIX behavior. At the same time, aggressive bears short directly into oversold band extremes, only to get crushed by violent counter-trend squeezes.
Disciplined technical analysis and modeled support and resistance levels cut through that emotional noise. With institutional algorithms driving over 70% of daily market volume, price action consistently respects the quantitative support and resistance levels posted here, a framework proven across two years of this publication.
Entering the week with directional probabilities based on technicals, predefined levels across an entire watchlist gives you an objective execution edge. It allows you to select high-probability setups, calculate exact risk-reward ratios, and trade your plan with composure.
While I highlight setups showing the strongest directional clarity and highest probability of reaching target levels, I map the matrix for every asset on our watchlist so you always have clear execution boundaries for popular tickers like SPX, QQQ, NVDA, AAPL, TSLA, AMD, and SLV.
Here is the core watchlist I actively track, covering multi-timeframe technicals, quantitative price levels, and comprehensive fundamental models, updated this week as downloadable files. If you trade any of these tickers, this publication is built for you:
Indices & Futures: SPX, NDX, DJI, IWM, ES=F, NQ=F
ETFs: SPY, QQQ, SMH, TLT, GLD, SLV, DIA, VXX
Major Stocks: AAPL, MSFT, GOOG, AMZN, NVDA, META, TSLA, SPCX, LLY, WMT, AVGO, COST, JPM, XOM, PLTR, NFLX, V, AMD
Crypto & Related: Bitcoin, Ethereum, ETHA, IBIT
Leveraged ETFs: TQQQ, SQQQ, UDOW, SDOW, UPRO, SPXS, URTY, SRTY
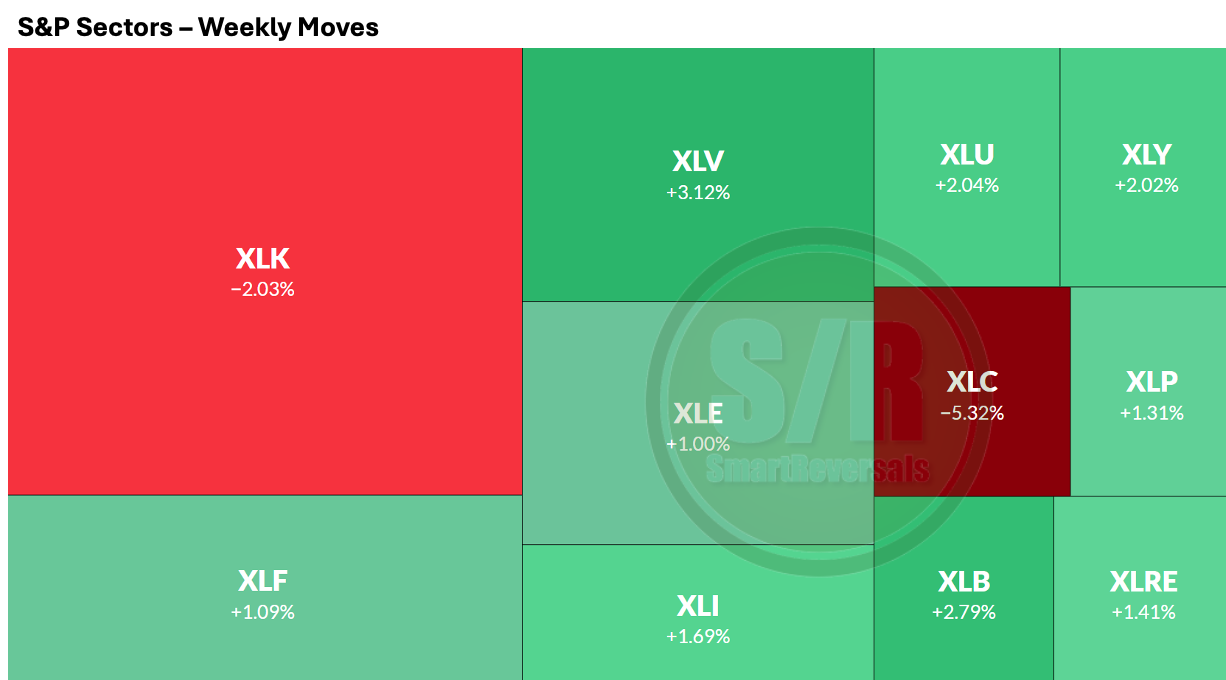
Another advantage of monitoring a watchlist including different sectors is to monitor and monetize from rotations, which is another topic we have been studied in this publication. See the 5 days performance per sector:
This week, for example, MSFT: Reached the 514.5 bearish target (-1.8%) after losing the CWL, XOM: Hit our 186.4 target (+1.8%), SPX: Tagged 7,567 as projected before extending down to 7,510 for a -1.5% flush, AVGO: Validated our bullish reversal thesis, reaching 335.1 and hitting our extended 348 target smoothly on Wednesday for an +8.0% move, and WMT: Hit our 122 target (+2.3%) and pushed toward 125.
MSFT, SPX, and AVGO reversed from their targets as concrete proof of institutional behavior with these weekly levels.
Every setup is provided with invalidation levels to protect capital, this week technicals for PLTR pointed higher, but when the stock slid -6.4%, our central weekly level (CWL) at 195.2 provided an immediate exit that capped the drawdown at roughly -0.8% with a slight buffer. For LLY indicators favored a healthy pullback, but blowout earnings sent the stock surging +11.3%. Our 1,277 risk parameter (just 0.4% above the prior Friday’s close) was the reference to neutralize exposure.
This combination of technical analysis, modeled levels, and risk management losses were held under -0.8%, while the winning targets averaged +3.5%. That structural asymmetry is how quantitative levels keep risk and reward strictly in your favor.
Ok, that’s weekly, what about longer term?
Bullish picks for October included COST, WMT, and TSLA, they gained +11%, 19%, and 12% respectively this month. I use monthly levels for longer timeframes also in this publication. Today there are three tickers that are in oversold conditions and brewing a move for November. They are described below.
Upgrade to a paid subscription to unlock this objective, quantitative framework. Paid members receive full access to daily market commentary, modeled weekly support and resistance levels for the tickers of your choice, our complete fundamental research library, and exclusive educational deep dives.
Everything is available at SmartReversals.com. Zero gut feelings. Everything is specific.
Today’s Agenda
Market Context: Charts+levels for SPX, Indices, ETFs, VIX, Breadth, and Crypto.
Momentum Map: Analyzing the stage per security - Long picks for November.
Deep Dive: Individual analysis with charts and targets for Mag Seven and setups.
Setups Blueprint: Entry levels for short and long setups with price targets and invalidation levels for all the securities in the watchlist prioritizing stronger setups.
Let’s begin.