Peeking Behind the Curtain: Unveiling Stock Market Activity with Level II and Order Book
See in real time the order book, which displays the best bid and ask prices for a security, along with the quantity of shares available per price level. Examples with SPY QQQ AAPL NVDA and more.
Level 2 and Order Book provide information underneath pice action
Price action has been bullish these days in terms of candles formation and direction, daily volume has been low versus other rallies but volume at price on the other way is setting strong shelves that are supporting price and are working as a launchpad.
LEVEL 2:
That’s the name of this technical tool, imagine a real-time window into the heart of the Nasdaq exchange. That's essentially what Level II data provides. It acts like a detailed playbook showcasing the buying and selling intentions of various market participants.
Who are the Players?
This play features several key characters:
Market Makers: These are the constant traders, ensuring a steady flow of bids and asks, keeping the market lively.
Electronic Communication Networks (ECNs): Think of them as automated matchmakers within the financial world, efficiently connecting buy and sell orders.
Wholesalers: They act as intermediaries between online brokers and the exchanges.
What Does Level II Show?
Unlike the basic stock price, Level II dives deeper, revealing:
The Best Bids and Asks: This highlights the most attractive prices offered by buyers (bids) and sellers (asks) at any given moment.
Order Sizes: This unveils the volume of shares each participant is willing to buy or sell at a specific price.
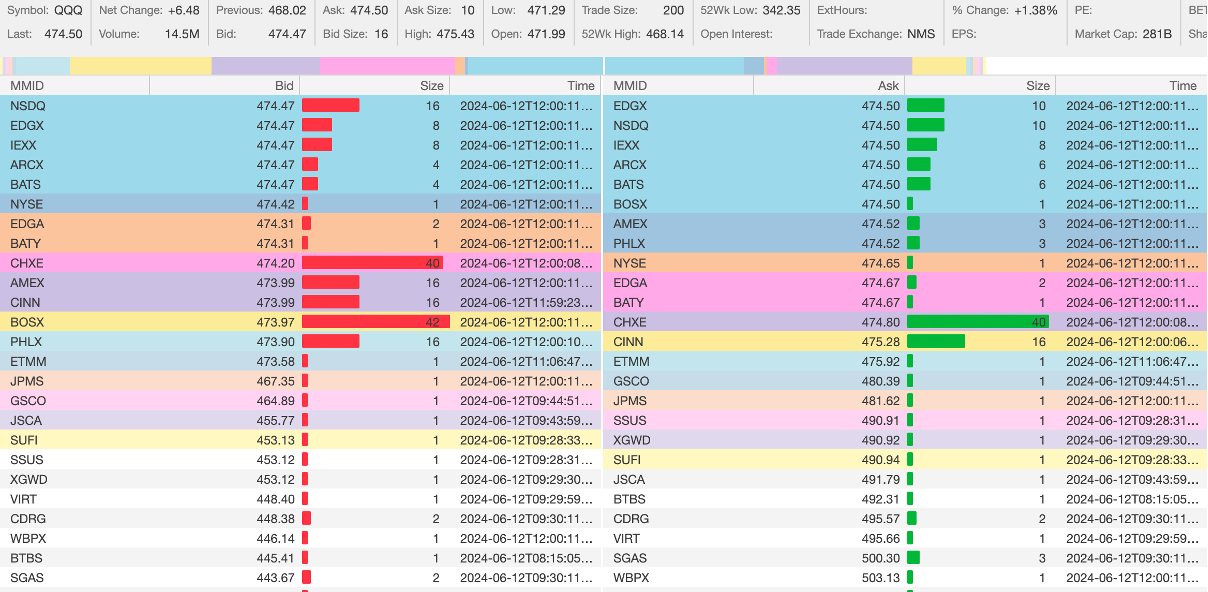
This is how Level 2 looked like today at noon for QQQ, this educational content will be focused on this type of chart.
This behind-the-scenes glimpse offers valuable insights, especially for day traders who make quick decisions based on market sentiment. By understanding the buying and selling pressures, traders can potentially anticipate price movements and make informed trading decisions.
In simpler terms, Level II is like a real-time stock market ticker that provides a granular view of who wants to buy or sell, how much, and at what price.
Level 2 data dives deeper than basic stock prices, giving you a behind-the-scenes look at the order book for a security. Here's how traders can leverage level 2 to inform their trading decisions:
Gauging Supply and Demand:


