
Rate Hike Expectations Locked In
Support and Resistance Levels: Indices, Futures, Magnificent Seven, ETFs, Crypto and more Megacaps

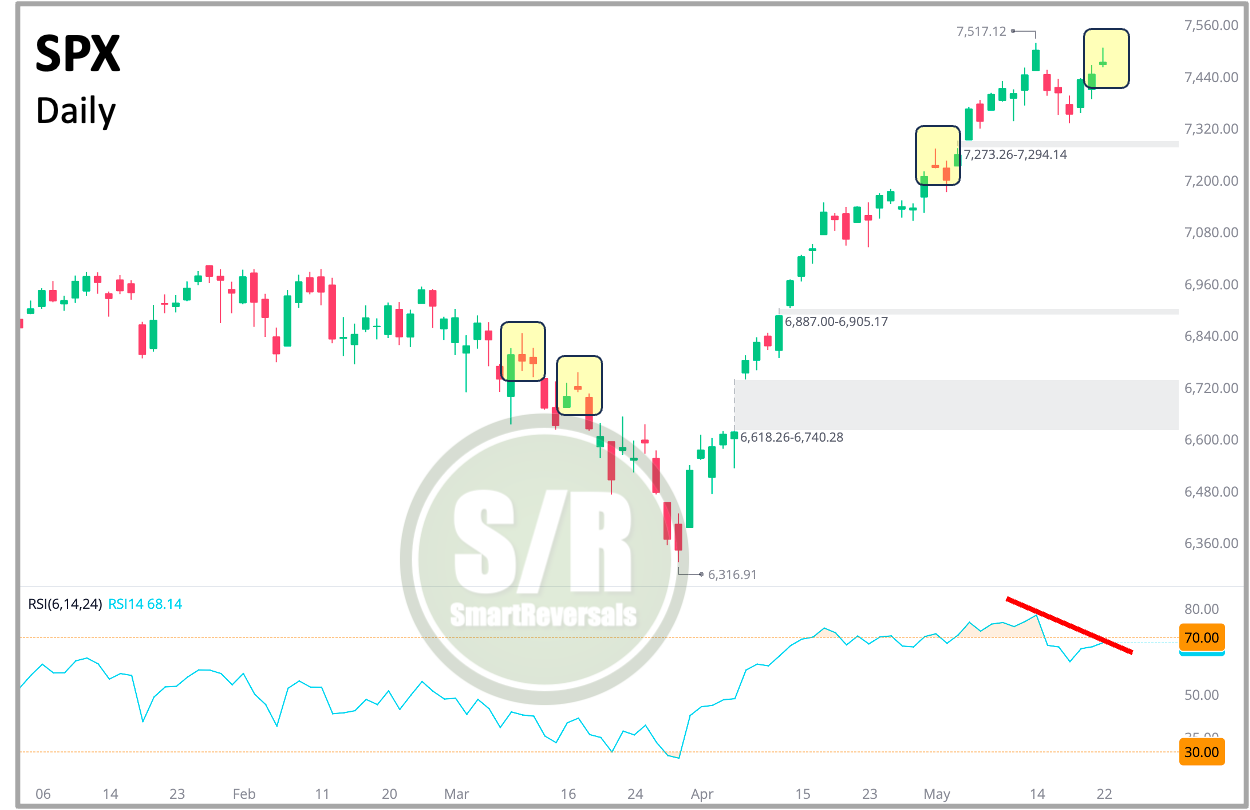
U.S. stocks advanced ahead of the long weekend, positioning the S&P 500 for an eight-week winning streak. This marks the longest weekly run for the benchmark index since December 2023. The S&P 500 rose 0.88% after approaching to our bearish target of 7,325 and bounced. The NDX gained +1.2% also after touching its bearish target of 28,609 and the Dow Jones Industrial Average added 2.2% during the week. This late-week strength emerged as investors absorbed falling government bond yields and a pullback in energy costs (Crude Oil fell -8.2% during these five days).
The positive finish capped a volatile five-day period defined by accelerating inflation and a global bond market selloff. April’s Consumer Price Index rose 3.8% year-over-year, surpassing market forecasts. This hotter-than-expected reading drove the 10-year Treasury yield toward 4.6%, its highest mark in over a year, while the 30-year yield climbed to levels unseen since 2007. Investors positioned for central bank rate hikes to combat inflationary pressure tied to Middle East geopolitical risk. Minutes from the Federal Reserve’s April meeting backed this expectation, showing a majority of officials viewing rate increases as appropriate if energy-driven inflation continues. A 25 basis point hike is now fully priced in for this year.
Sectors and asset classes shifted materially under these macro conditions. Higher borrowing costs weighed on materials and utilities, both posting steep weekly declines. Corporate earnings drew sustained focus, particularly quarterly results from Nvidia (-4.4%) and major retailers like Walmart -8.5%). In digital assets, Bitcoin dipped below $80,000 early in the week and is closing Friday near $75K.
Support and Resistance Levels
Trading is entirely about probabilities and risk management, probabilities based on technical indicators that provide directional references for price action, and risk management using price targets and invalidation levels. Every Friday the support and resistance levels for the week ahead are modeled, these levels have proven to frame price action ad the Setups Blueprint posted in the Weekly Compass anticipated for this week:
Example of targets set for this week:
LLY hit the bullish extended target of $1,069.9 (+6.5%) 🎯
COST hit and crossed $1,075 (+2.6%) 🎯
PLTR touched $138.0 (+3.0%) 🎯
TSLA nailed its downside target, hitting our 394.2 modeled (-6.6%) 🎯
IWM hit my bearish target of 270.8 (-2.4%) 🎯
Example of Risk Management:
META was expected to print a bullish move targeting $627 (+2.2%), the primary move was bearish, so the invalidation level of $610.2 (only -0.7%) acted as a reference to manage risk, protecting capital from the selloff to $596.6 (-2.9%).
Every weekend I publish the setups for all the securities of our watchlist, I highlight the ones that I see with the highest probability given the market conditions, but you can choose your own, for example, the setup for V (Visa) anticipated 330 as target and 335 as extension target, with an invalidation level at 324. The high of the week was 335 🎯.
The levels covered every Friday for the week ahead include:
Indices & Futures: SPX, NDX, DJI, IWM, ES=F, NQ=F
ETFs: SPY, QQQ, SMH, TLT, GLD, SLV, DIA, VXX
Major Stocks: AAPL, MSFT, GOOG, AMZN, NVDA, META, TSLA, BRK.B, LLY, WMT, AVGO, COST, JPM, XOM, PLTR, NFLX, V, AMD
Crypto & Related: Bitcoin, Ethereum, ETHA, IBIT
Leveraged ETFs: TQQQ, SQQQ, UDOW, SDOW, UPRO, SPXS, URTY, SRTY
Subscribe to the paid plan, and unlock essential information for next week.
SPX: The indecisive candle suggests caution and most likely a pullback next week. The Central Weekly Level that must be breached to validate that thesis and the potential targets are posted here.
Weekly levels for swings, monthly levels for longer term investments, they are here and the tables below show them combined.
WEEKLY LEVELS