
Risk-Reward: Is Tech Better Than Defensives Today?
Analyzing oversold growth signals against the backdrop of overextended value / defensive sectors. High Probability Setups - Key Indicators to Navigate the Week.

As anticipated last week, there was a chance that certain targets would not be fully reached, given how overextended the moves had become for the securities selected. The gap required to hit those primary targets was substantial. Despite this, several of our high-probability setups performed well: QQQ moved toward the $583.1 target, and SPY neared well its $673.8 objective. Additionally, ExxonMobil (XOM) successfully reached its target of $145.3.
We also held a bearish outlook for Apple (AAPL), which serves as an important case study analyzed in the charts below. While Apple moved lower in Tuesday’s pre-market, reaching our -3.3% target proved difficult in the overextended bearish environment. Similarly, while we expected a bullish move in Costco COST at the start of the week, it partially materialized. The target was $1,038, but the price topped at $1,028 on Tuesday. While the direction was accurate for the early week, it fell short of our ultimate target; therefore, I am classifying that setup as “vanished” in our track record.
As mentioned last Saturday in this publication:
While Friday showed indecisive price action that could hint at a potential bottom, the price is far from oversold enough to match previous patterns that triggered bounces. A rapid flush on Tuesday could provide stronger bottoming signals
The bounce was likely and we will study the same chart from last weekend keeping the highlighted candles that in the past were followed by a flush the first day of the week, just to bounce and closing in the green.
As I highlighted to premium subscribers, holidays often result in blurry visibility, where setups may fail to complete or reverse entirely during Sunday and Monday futures sessions.
Crypto Continues Weak
Bitcoin (BTC) and Ethereum (ETH) suggested a bullish reversal on Saturday, those setups were ultimately invalidated. In trading, discipline is key: the trigger for Bitcoin was never activated because the $70,8K level was not breached. Since the price was rejected once again, there was no material damage to our setups in IBIT and even ETHA.
Opportunities Brewing
Looking ahead, the same overextension that prevented some bearish targets from being reached is now creating potential reversal opportunities. Using our indicators and modeled Central Weekly Level (CWL), several securities now show a bullish bias for the coming week. We will study the specific CWLs and targets for names attempting to reverse, including Palantir (PLTR), Broadcom (AVGO), Amazon (AMZN), Netflix (NFLX), Nvida (NVDA) and even Crypto, though the two latter requires extreme caution given the earnings report and the weakness in Price action respectively.
From these securities and others within our fixed universe of megacaps and high-volume names, we have identified the highest probability setups for the week ahead. Each includes a specific risk-management level. Let’s dive into the game plan and the key indicators to watch.
Our Core Watchlist:
Indices & Futures: SPX, NDX, DJI, IWM, ES=F, NQ=F
ETFs: SPY, QQQ, SMH, TLT, GLD, SLV, DIA, SH, PSQ
Major Stocks: AAPL, MSFT, GOOG, AMZN, NVDA, META, TSLA, BRK.B, LLY, WMT, AVGO, COST, JPM, PLTR, NFLX, XOM
Crypto & Related: Bitcoin, Ethereum, ETHA, IBIT
Leveraged ETFs: TQQQ, SQQQ, UDOW, SDOW, UPRO, SPXS, URTY, SRTY
Setting the price targets and invalidation levels are based on technical indicators and modeled Support and Resistance levels for each week and month.
These educational publications present how to manage the high probability setups, upgrade your subscription and unlock this valuable guides:
Join the paid plan today to trade with institutional-grade precision.
Before the Weekly Plan: Sectors and Rotation
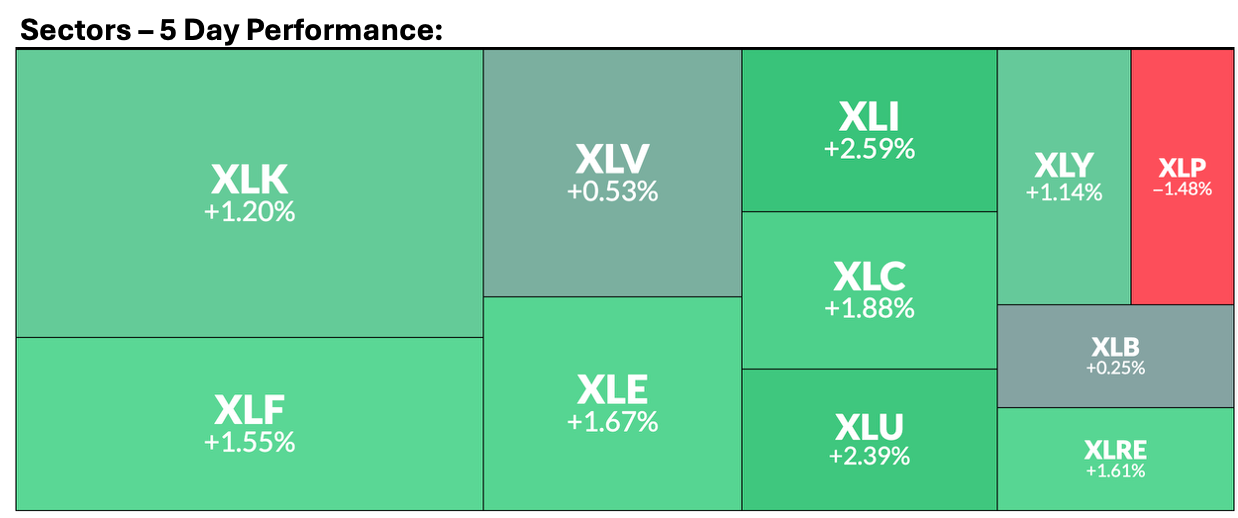
The market is currently undergoing a "Great Rotation," a structural shift where capital is exiting former high-flying technology and software sectors to seek refuge in defensive and "old economy" areas like Energy, Utilities, and Consumer Staples. This bifurcation has created a split market where the S&P 500 remains near all-time highs only because rallying defensive sectors are offsetting sharp declines in tech heavyweights, which now act as an anchor on the index. This rare divergence, where Consumer Staples hit new highs while Technology hits new lows, has only been observed once before, in late 2000, signaling a potential shift in long-term market leadership.
Be careful chasing, week by week the rotation headline has become more popular, and if you have been in the investment arena for a couple of years you know what happens when an asset becomes more popular (in this case Consumer Staples, Healthcare, Utilities, and other defensive sectors).
We have nailed bullish moves with LLY, WMT, BRK.B, and JPM, but that happened several weeks ago when their setups were brewing a bounce, and the use of specific targets was helpful to lock gains ahead of choppy price action.
That said, last week I anticipated a bearish reversal for XOM, LLY is looking weak, and this Wednesday I will post a second edition about sectors, because many of the defensive ones are overbought. Be careful chasing the herd, anticipate the moves here.
On the other side, Software is extremely oversold, and some giants are suggesting some bearish exhaustion, let’s study the individual setups so you are equipped with indicators and levels to set targets or managing risk.
Potential Bounce in the Market?
Probably, oversold sectors are bouncing (XLK and XLY), while others continue in the green (not Staples) but are overbought.
By mastering a constant universe of ‘Megacaps’ and Indices, you can identify capital rotation and time your entries with precision, rather than chasing random tickers.
Today’s Agenda
The Momentum Map: Analyzing the stage of every security in a single chart.
Setups Blueprint: High-probability trades and full universe analysis (track your favorites or use the ones I highlight).
Market Context: Technical charts and price levels for U.S. Indices, Volatility, and Bitcoin.
Deep Dive: Individual analysis of Metals and Mega Caps.
Let’s continue, my two eBooks on Essential, and Advanced Technical Indicators are below to download.