
S / R Levels Aug 19th - 23rd
The market has now spent two weeks in a V-shaped recovery, is it time for a consolidation? - Measure potential resistances for the week ahead.


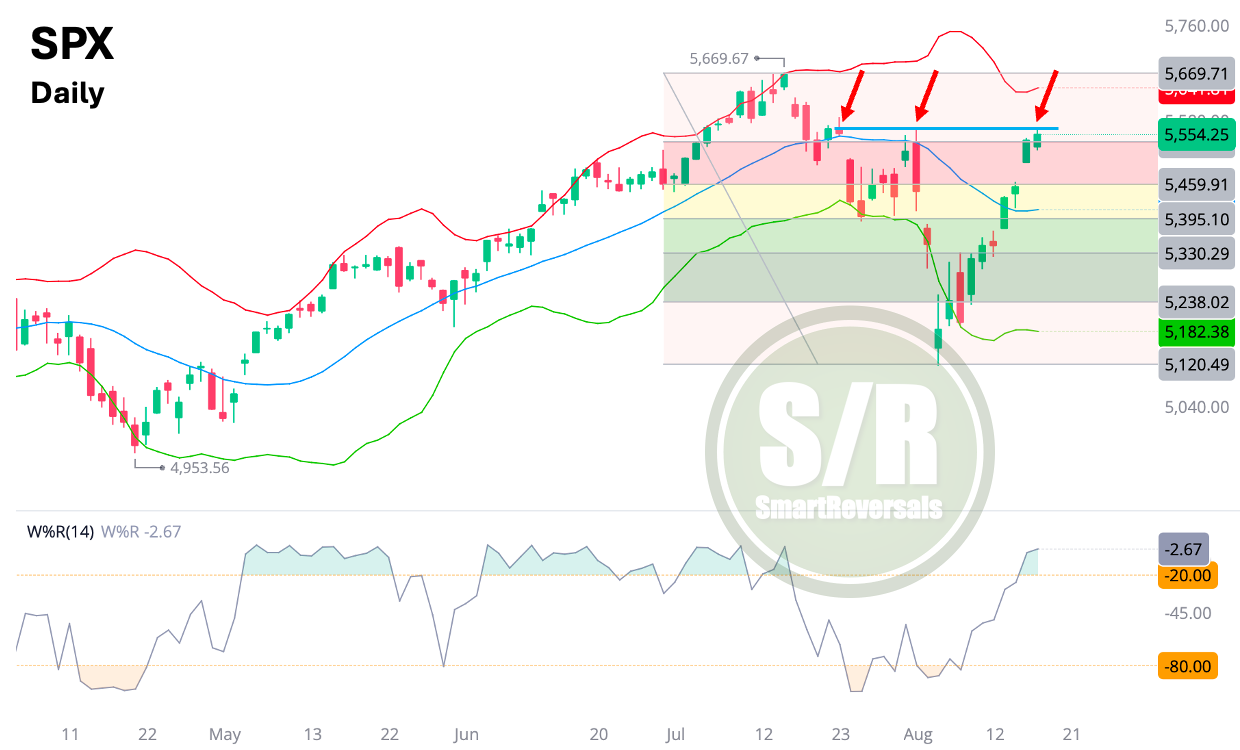
SPX - Daily Chart:
The move today passed the 78% Fibonacci retracement from the recent bottom, which is positive, however price found rejection for the third time at the $5560 zone. It would not be surprising to see some consolidation at this point considering some oscillators that are entering in overbought zone as charted below.
Consolidations or temporary breathers are healthy, actually I don’t like the gap left behind yesterday, considering the uncertainty that exists in the market regarding interest rates and other macro factors.
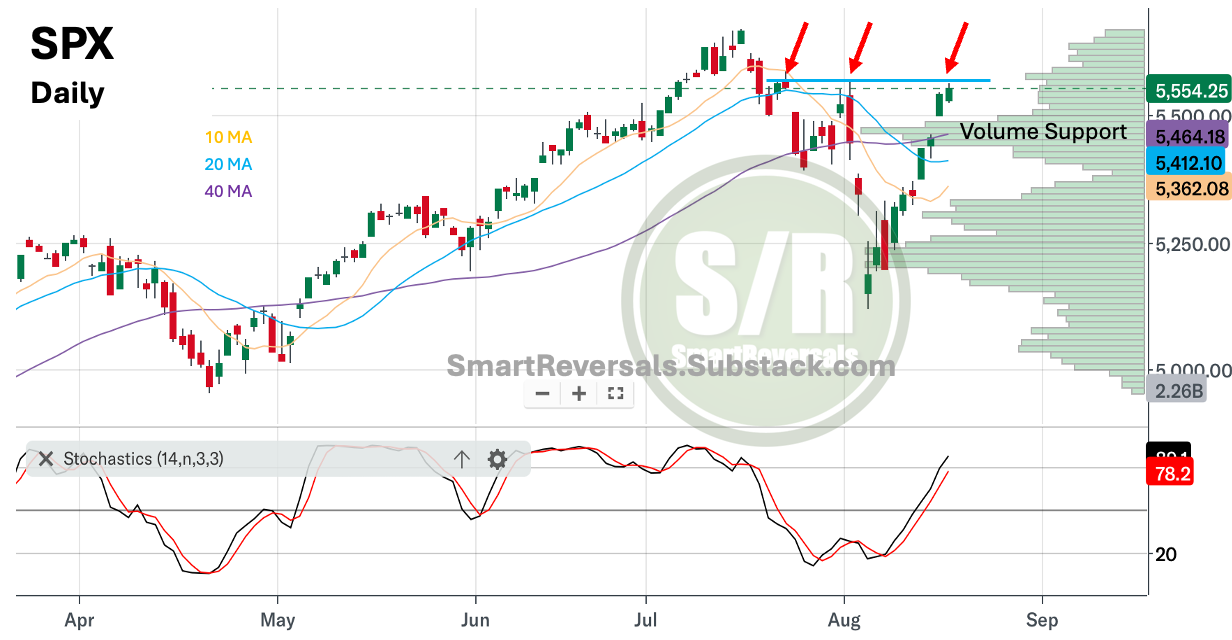
A second view for SPX
In the educational section of this site (Level Up Your Trading), there are more than 20 indicators already studied, one of them is worth studying today, since it is providing signs of support.
Good news for bulls, is that volume at price is showing a shelf at the gap level, which has confluence with the 50DMA.
That means that there is space for a consolidation and $5450 is strengthening as support.
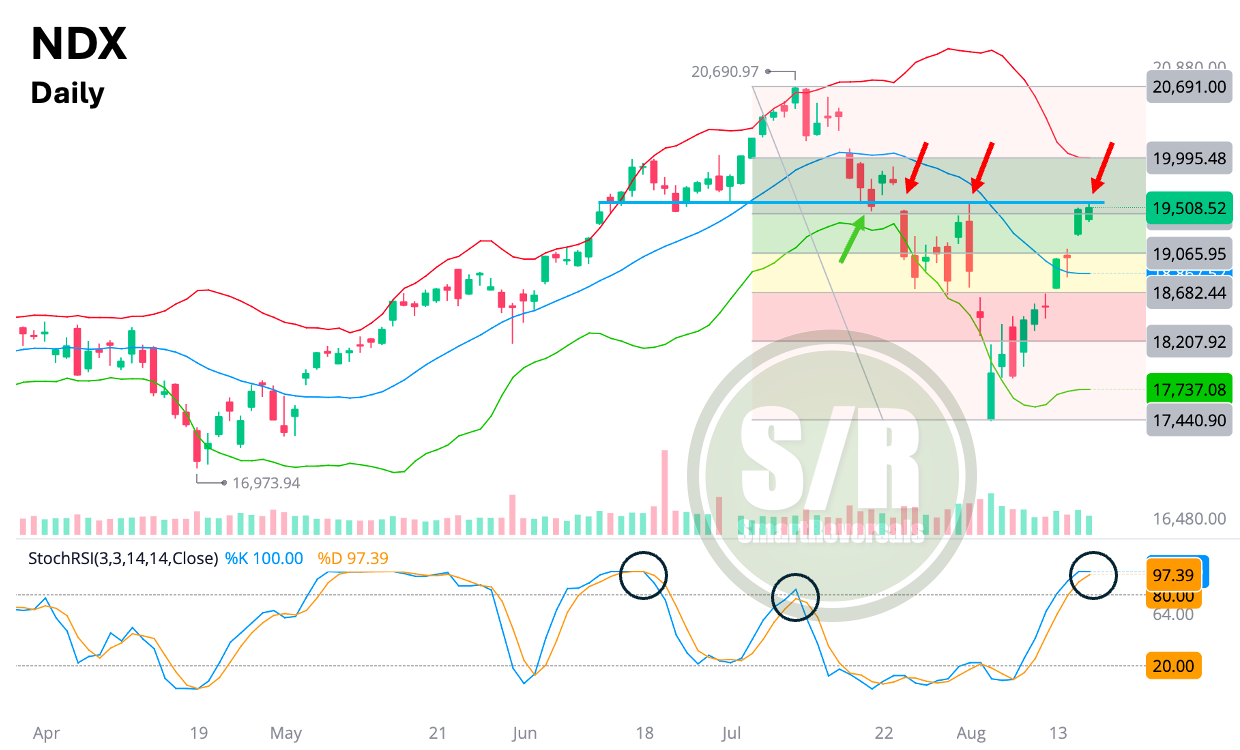
NDX - Daily Chart:
Also suggesting a potential consolidation ahead considering the oscillator and the recent high of the day that is still in the Fib zone and the resistance line highlighted.
We all know that a fast oscillator can stay overbought or oversold for long, that happens when there is strength in the market. The strength of the bounce is to be tested now as written yesterday in the market recap (free and open for everyone).
Same as SPX the lower gap can be considered potential support, in this case at $19100, matching the 50% Fib retrace from the recent bottom/crash.
To learn more about oscillators, the following publications may be of your interest:


So far, the analysis has been centered at the potential consolidation, the question now is, what if there is still more strength of the rally? in the end the candle does not suggest a reversal and there is a breadth trust signal preceding this move.
To answer that question, the weekly measurement of Support and Resistance Levels continues, including SPX, NDX, IWM, DJI, NVDA (earnings imminent), TSLA, AAPL, GOOG, GDX, SILVER, ES=F, NQ=F, and more. Subscribe and unlock the content, the educational material and the weekly compass that includes more than 20 charts every weekend.