
S / R Levels Aug 5th - 9th
The market breached the central support level. However, the pace of the decline was extreme, and certain timeframes are already oversold. Identify potential support levels for the upcoming week.


The Bear Took Over Tech
Last Wednesday, I published a bouncy VIX chart as a warning to subscribers. Employing this alert and setting a stop loss based on the central support/resistance level (blue on the chart below) could have significantly mitigated losses for many.
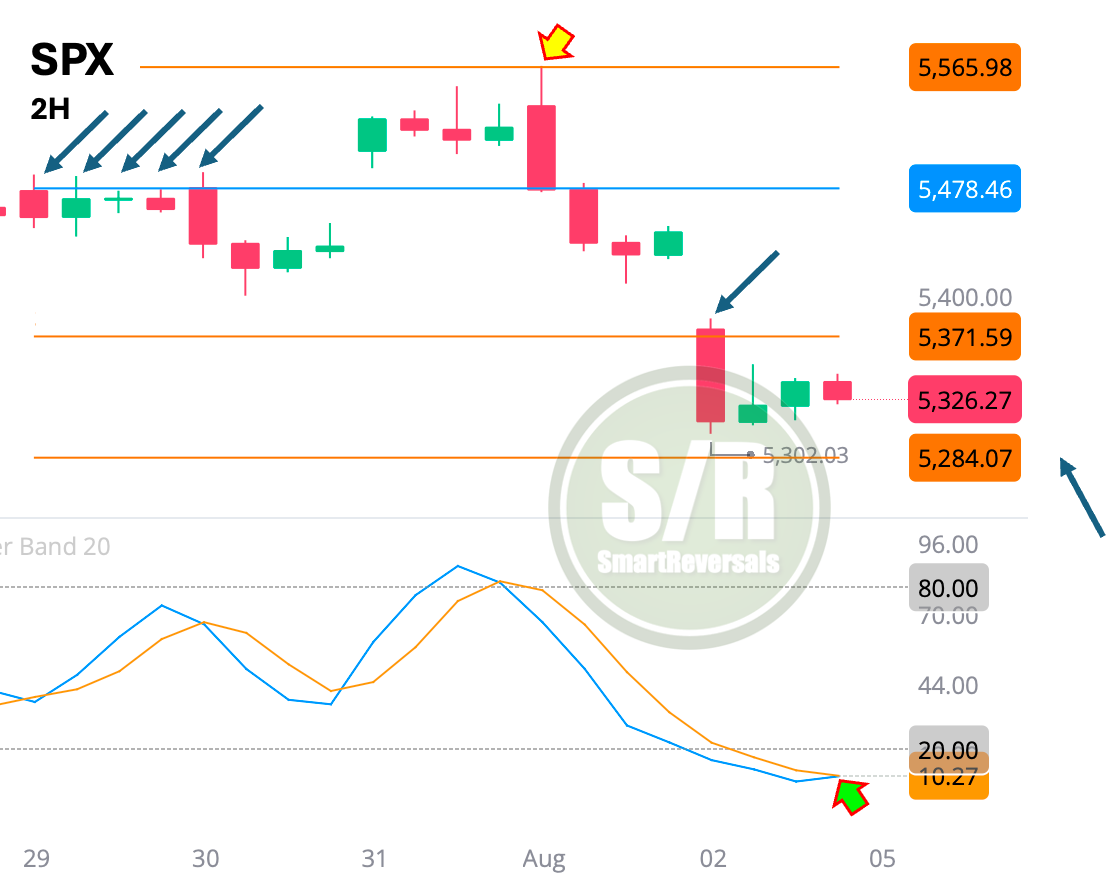
The two-hour chart highlights the resistance established on Monday and Tuesday. The Wednesday rally proved to be a bull trap, encountering resistance at the $5565 level, a level published last week.
Notice how price attempted a rebound at the second support level, $5284. These levels serve as a blueprint for the upcoming week, with bullish implications above the blue line and bearish below, allowing for potential decline measurements. The recent sell-off was exceptionally sharp, breaching two levels within just two days and nearing a third one.
For next week, the central level aligns with a resistance zone as indicated in the weekly overview. Given the daily chart and two-hour timeframe oscillator, a potential bounce on Monday or Tuesday is plausible, the watch out point is the updated central level indicated below.
Let me share with you a chart, I know there is a lot of fear and as I anticipated for Subscribers: “Sentiment and trading psychology will be tested in the weeks ahead”, and that is exactly what is happening.
QQQ:
Observe the precision of the 23.6% Fibonacci Retracement, which acted as support in conjunction with the monthly support/resistance level of $449, presented below.
Managing risk through the use of support and resistance levels for next week is a good idea for those considering entering the market. A comprehensive chart with additional technical indicators will be published in the Weekly Compass tomorrow.

This edition of S/R levels has updated the weekly and monthly levels for:
SPX, NDX, DJI, SPY, QQQ, IWM, ES=F, NQ=F, NVDA, META, MSFT, AMZN, GOOG, AAPL, TSLA, GDX, SILVER and OIL. Subscribe and plan ahead your trades.
Weekly S/R Levels: