
S / R Levels Dec 23rd - 27th
Locking in gains at the central level on Wednesday was the winning move, paving the way for a strategic re-entry into oversold territory - SPY and VIX charts for everyone.


The market's decline on Wednesday served as a beneficial correction, resetting overbought technical indicators and reinforcing the value of technical analysis in anticipating sharp pullbacks following such conditions.
Properly identifying support levels is crucial for effective risk management and profit protection, especially during sudden market downturns. A recent example highlights this: when expectations for 2025 interest rate cuts fell short of market consensus, a critical support level at $6057 was breached. This triggered a significant one-day decline across major indices: 3% for the S&P 500 (SPX), 3.6% for the Nasdaq (NDX), 4.4% for Small Caps, and 2.6% for the Dow Jones.
This underscores the importance of using support levels as references for stop-loss triggers to limit potential losses when unexpected news impacts the market. Moving forward, this edition analyzes the daily charts of the SPX and the VIX (Volatility Index), along with key support and resistance levels for more than 30 securities, to measure and validate potential market movements in the coming week.
SPY
The premarket session found support at the current volume shelf, leading to a bounce at Friday's open. While the resulting candle shows volume validation, it encountered resistance at both the 5-day moving average (5DMA, grey line) and the 50-day moving average (50DMA, purple line), failing to break above them.
If the market continues to aggressively buy any pullbacks, a short-term bottom may be in place, especially given the current status of the Williams %R and the price action at the lower Bollinger Band.
However, there is underlying weakness indicated by the lack of buying conviction at the close, suggesting a potential downward move. This move, however, is likely part of a broader bounce, as illustrated by the black arrows.
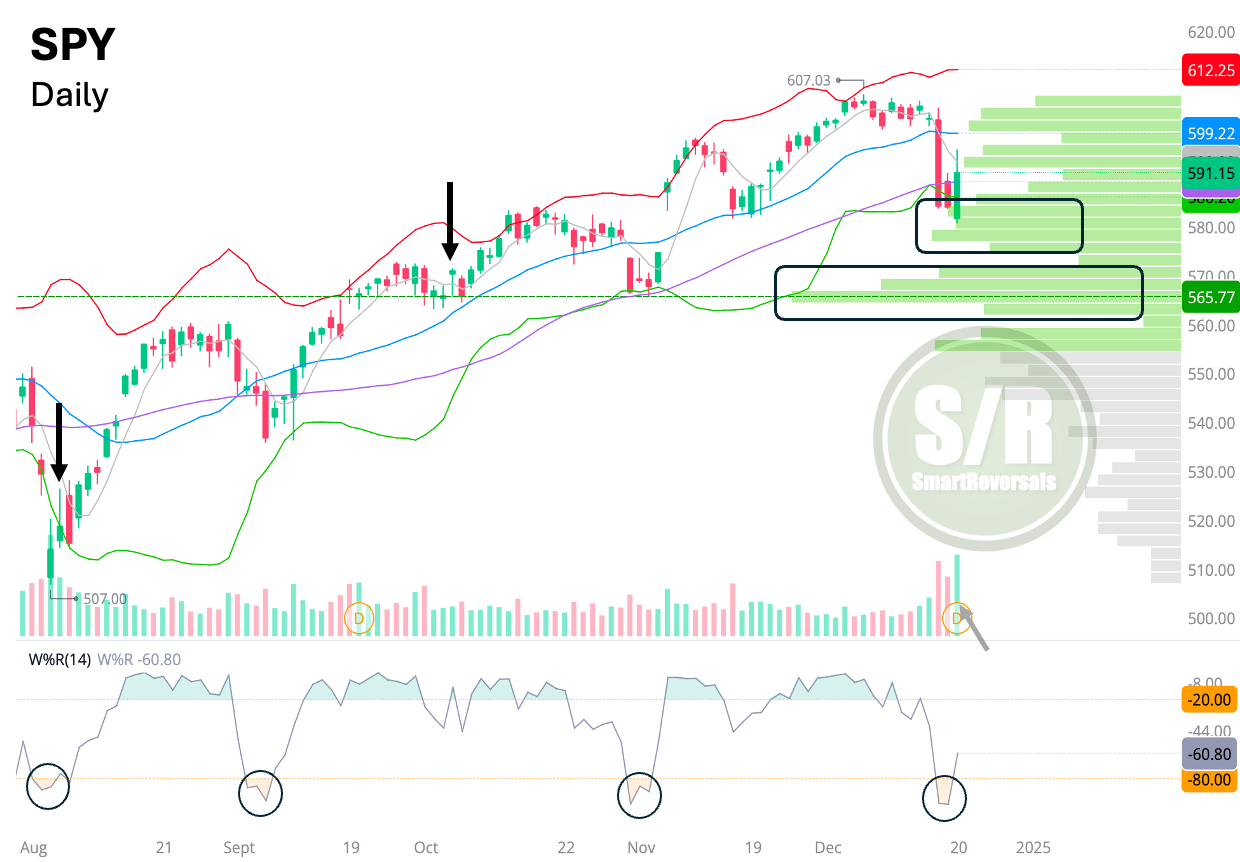
The key support and resistance (S/R) levels for the upcoming week include the central level, which must be reclaimed to confirm a reliable bounce. Next Wednesday's "Level Up Your Trading" edition will feature updated educational content on the significance of the central level. This will allow new subscribers to observe this level's behavior over the past several months and analyze the market's reaction to its breach or recovery.
VIX
The VIX, or Volatility Index, is a real-time market index representing the market's expectation of 30-day forward-looking volatility. It is derived from the price of S&P 500 index options, and it's often referred to as the "fear gauge" or "fear index" because it tends to spike during times of market uncertainty and decline when the market is calm.
The VIX generally moves inversely to the S&P 500 (SPX) due to the nature of options pricing and investor behavior:
Options Pricing: The VIX is calculated based on the prices of S&P 500 options, specifically the implied volatility of those options. Implied volatility reflects the market's expectation of how much the S&P 500 is likely to fluctuate in the future. When investors are worried about a market downturn, they tend to buy more put options (which give them the right to sell the S&P 500 at a certain price). This increased demand for put options drives up their prices, which in turn increases the implied volatility and thus the VIX. Conversely, when investors are optimistic, they tend to buy more call options (which give them the right to buy the S&P 500 at a certain price). This can decrease the implied volatility and the VIX.
Investor Behavior: The VIX reflects investor sentiment. When the market is rising steadily, investors are generally confident and complacent, leading to low demand for options and a low VIX. However, when the market starts to decline, fear and uncertainty increase, leading to a surge in demand for protective put options and a spike in the VIX.
Here's a simple analogy: Imagine you're driving on a highway. When the road is clear and traffic is flowing smoothly (like a rising SPX), you're relaxed and don't feel the need to brake hard or swerve (low VIX). But when you encounter heavy traffic or bad weather (like a declining SPX), you become more cautious and anticipate the need to brake or swerve suddenly (high VIX).
It's important to note that the inverse relationship between the VIX and SPX is not always perfect. There can be instances where both move in the same direction, although these are less common. For example, during periods of extreme market stress, both the SPX and VIX can rise simultaneously as investors rush to both sell stocks and buy protective options.
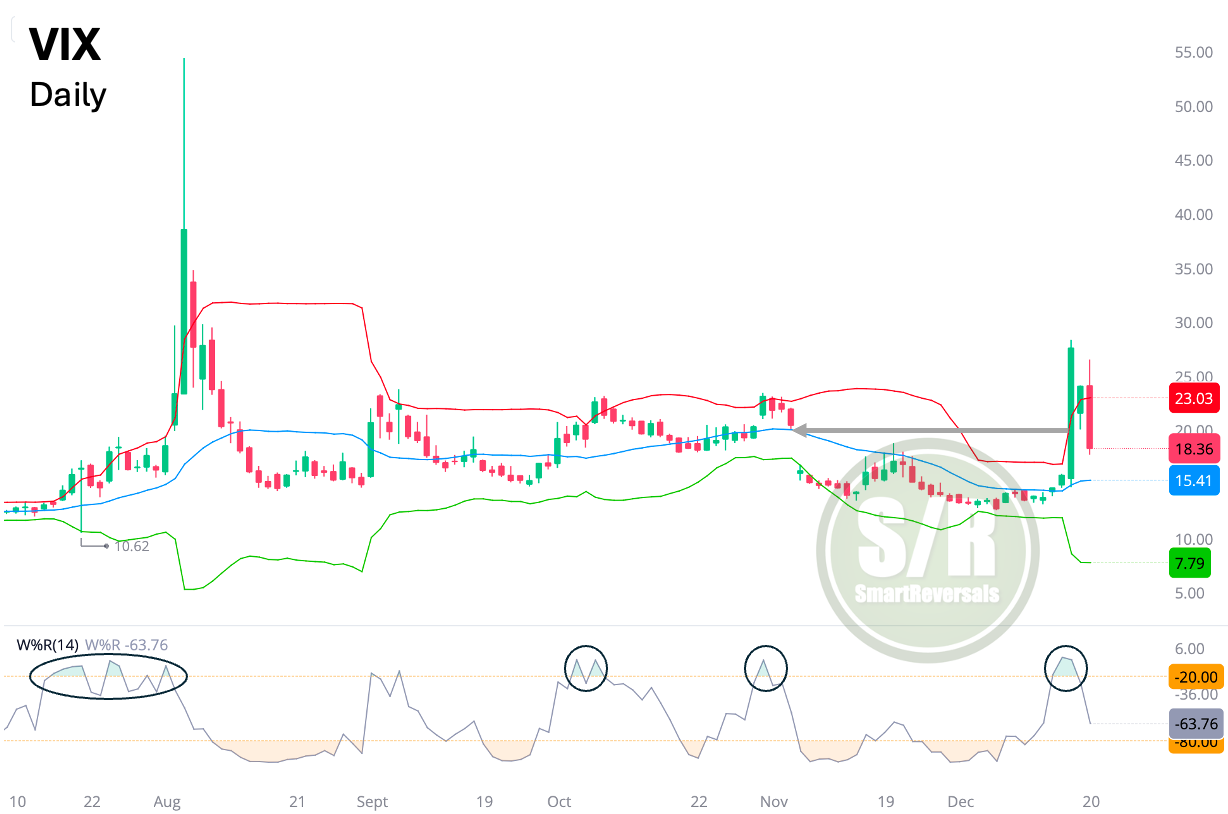
Today, the VIX also suggests that volatility may have found overbought levels considering the action along the higher Bollinger band, 17.5 has to be breached to consider a reliable bounce in the market next week.
And for premium subscribers: observe that 1.5 months ended up as a correct expectation for a gap fill as highlighted by the grey arrow.
Key levels to overcome to consider a reliable bounce, and also key references for bull and bear thesis
If you invest in some of the following securities, the premium content is for you: SPX, NDX, DJI, IWM, SMH, TLT, NVDA, TSLA, PLTR, AAPL, MSFT, GOOG, META, AMZN, GLD, SLV, SPY, QQQ, DIA, TQQQ, SQQQ, UDOW, SDOW, URTY, SRTY, NFLX, AMD, COST, ES=F, NQ=F, BTC, ETH, or MSTR.
WEEKLY LEVELS: