
S / R Levels - Jan 27 - 31
Although momentum is back, the presence of three gaps could act as a magnet, especially given overbought technicals. Price looks exhausted.


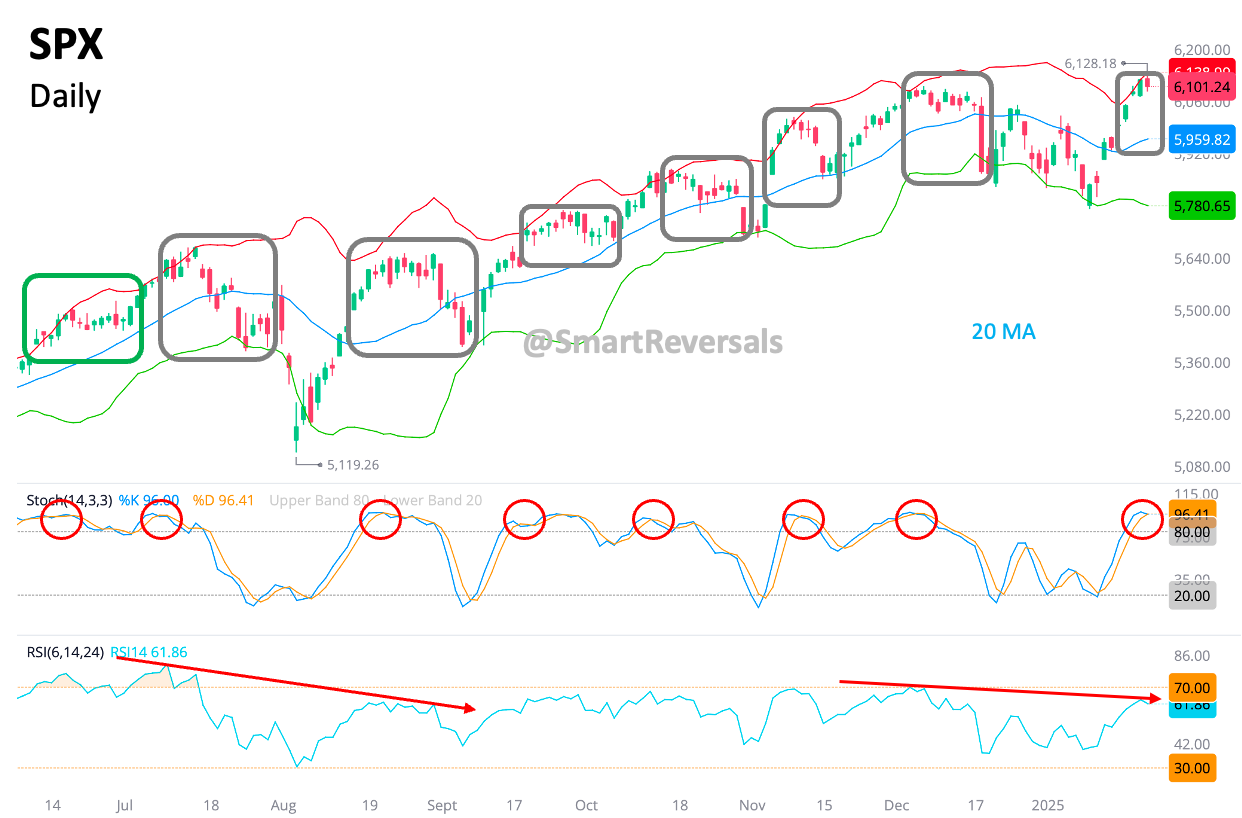
Momentum is back, but some technical indicators are showing exhaustion, caution is key and the chart for SPX suggests that a visit to the 20DMA is very likely.
SPX - 20DMA Test Imminent:
The grey squares mark previous occasions when price has tested that blue line. In the past, when the Bollinger Band has been breached and/or oscillators have been overbought, price has invariably moved to the 20DMA. Both conditions are in today. Will this time be different like the green square? No, wait, that one also preceded a visit to the 20DMA.
To add more spice to the recipe, the divergence between price and the Relative Strength Index is a condition that matches the current overbought context (higher highs for price, and lower highs for the oscillator.
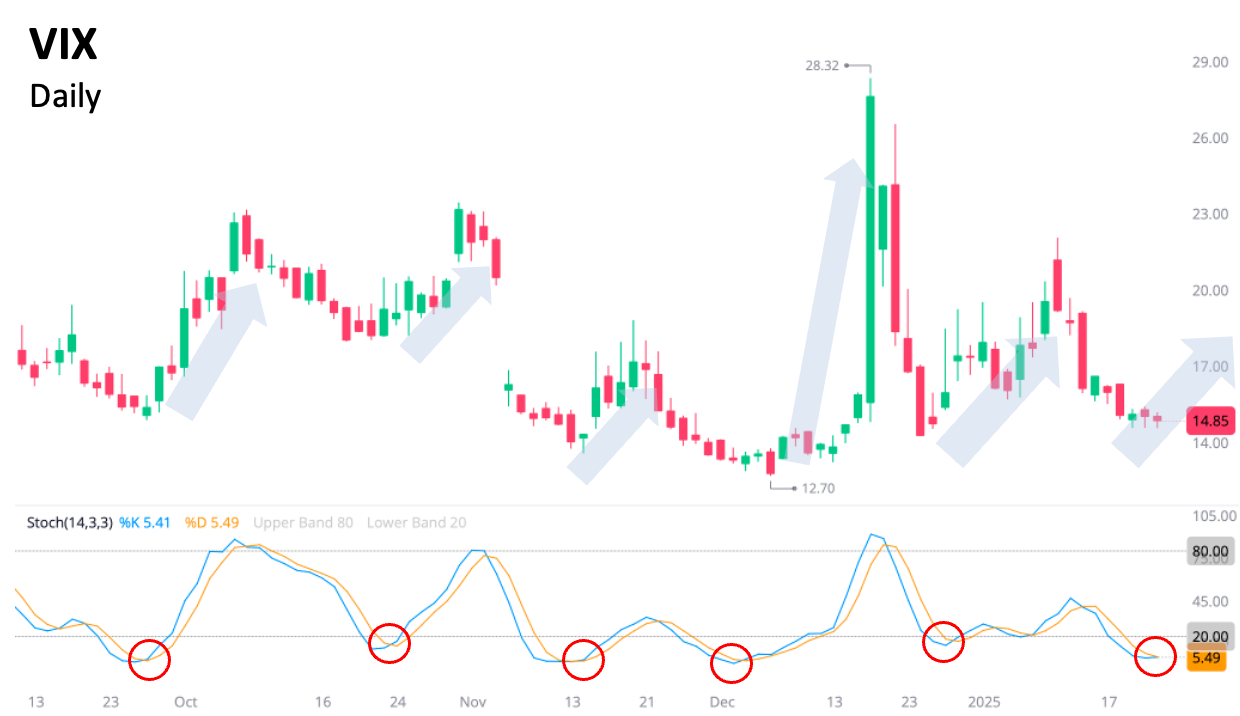
VIX
The volatility index, most commonly known as the VIX (Volatility Index), is a real-time market index that represents the market's expectation of future volatility in the U.S. stock market. It's often referred to as the "fear gauge" or "fear index" because it tends to rise when investors become more uncertain or fearful about the market's direction.
Generally, the VIX has an inverse relationship with the S&P 500. When the S&P 500 goes down, the VIX tends to go up, and vice versa. This is because market declines often lead to increased uncertainty and fear, which drives up demand for options (especially put options, which are used to hedge against losses), thus increasing the VIX.
Just observe the chart, the red circles present crossovers that precede spikes in the Volatility Index, and there is a new crossover today that suggests a spike is coming. The indecision candles are quite bouncy as well.
Considering the overheated technicals, the central level provided every week has proven to be the best insurance against bearish confirmations (when trading in long positions). Let’s study the context for next week:
NFLX
Bullish continuation if this key level continues as support: $943.8
The next upside target is: $1032.8
Potential bearish reversal target if the key level is breached: $888.6
AMD
Bearish continuation if price continues below this key level: $123
Immediate target for bearish continuation: $120.4
Potential bullish reversal target if the key level is recovered: $125.5
And if price action crosses a line with conviction, the following level is to be watched.
NFLX surged 14% this week. Was that out of the S/R Levels? No, price is consolidating at $984.9, a monthly level provided in advance since the beginning of January.
For new premium subscribers, please read this publication from December, with a comprehensive overview of the Support and Resistance Levels.

Remember, this publication covers 35 securities: SPX NDX DJI ES=F NQ=F SPY QQQ IWM DIA SMH TLT TQQQ SQQQ UPRO SPXS UDOW SDOW URTY SRTY NVDA META MSFT AMZN GOOG AAPL TSLA NFLX COST MSTR PLTR AMD GLD SLV BITCOIN ETHEREUM. If you trade some of them, this publication is for you.
Let's now examine weekly and monthly support and resistance levels, with examples for ES=F, NQ=F, SPY, QQQ, and DIA.
The application of the Levels for U.S. Indexes, IWM, SMH, Mag 7, Palantir, GLD, SLVR, and Bitcoin will be presented tomorrow with charts and technical indicators as usual.
ES=F
Bullish continuation if this key level stays as support: